University of Cincinnati
ECE&CS Department
EE-612
Microwave Communication Lab.
Prepared by: Prof.Altan M. Ferendeci
Experiment #5
X-Band Cavity IMPATT Oscillator
Purpose:To use an IMPATT diode as a means of generating microwave signals. The diode is a two terminal device and has a negative resistive part if properly operated. Therefore, it can be used as a source of microwave signal generation. The frequency of oscillation is determined by a microwave cavity and tuning is obtained by changing the dimensions of the cavity.
Instrument Spectrum Analyzer, Power meter.
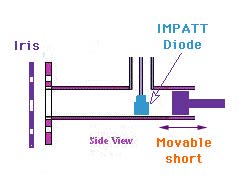
- Use a power supply consisting of regulated power supplies in series, with a 10 W 2 watt resistor in the output. Connect successively a variable back short cavity IMPATT oscillator, with a 0.30" iris, an E-H tuner, a directional coupler, an X-band cavity attenuator, a wave meter, and a power meter. Connect a spectrum analyzer to the directional coupler and in each of the tests below observe the output on the spectrum analyzer.
- Set the attenuator at 10 dB and leave it at this value throughout the experiment.
- Adjust the power supply for current increments, in approximately 20 mA steps, between the lowest value at which oscillations are observed and 180 mA. In each case adjust the back short position and the E-H tuner for maximum power output. Plot curves of power output and frequency -vs- operating current.
- With approximately 180 mA in the diode, use successively irises of 0.25", 0.30", 0.35", 0.40", and the iris plate removed altogether. For each case adjust the back short position and E-H tuner for maximum power output and determine the frequency of oscillation and the distance from the cavity post to the back short. Convert this distance to wavelength in the waveguide. Plot curves of frequency, power, and post to back short distance (in wavelengths) -vs- iris diameter.
- For case 4, for each iris, measure the phase noise of the oscillator and plot phase noise -vs- iris diameter.
- With approximately 180 mA in the diode, and using the 0.30" iris, adjust the back short and E-H tuner for maximum power output. Back off the back short adjusting screw (counterclockwise) until the power drops to zero. Readjust the screw clockwise, in half turns increments. At each position adjust the E-H tuner for maximum power output and determined the frequency of oscillation. Plot curves of frequency and power output -vs- post to back short distance (in wavelength).
Noise generated by transistors and passive devices show up at the output signal of amplifiers. In the case of an oscillator, which is a nonlinear devices, these noise voltages and currents are modulating the signal produced by the oscillator.
L(fm) = the ratio of power in a 1-Hz bandwidth at fm offset from the carrier to carrier signal power
L(fm) = N (1-Hz BW) /C (dBc/Hz)
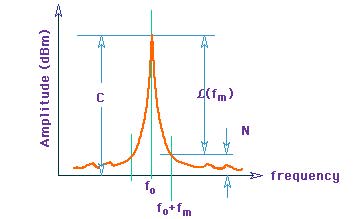
The oscillator output is read off the screen in dBm. The noise at a frequency offset fm away from the carrier may also be read directly. Noise measured in this way will usually require correction factors, since the detector of the analyzer is ordinarily an envelope rather than a true rms detector, the log amplifier noise peaks less and the bandpass filters may be Gaussian or trapezoidal in shape, which requires corrections to the square bandpass. Additionally, since 1 Hz bandpass filters are uncommon, this results in a measurement of noise in a wider bandwidth which may be corrected to 1 Hz by reducing the noise measured by 10 dB for every decade by which the filter is wider than 1 Hz.
Applying these corrections,
L(fm) = noise power with corrections at fm/ carrier power
= N(1-Hz BW)/C
Note that this technique is most useful when it can be determined that the noise of the oscillator being measured is worse than that of the local oscillator of the spectrum analyzer.
Reference: Microwave Transistor Amplifiers, G. Gonzalez, Prentice Hall, 2nd Edition (1997).
Goto Homepage