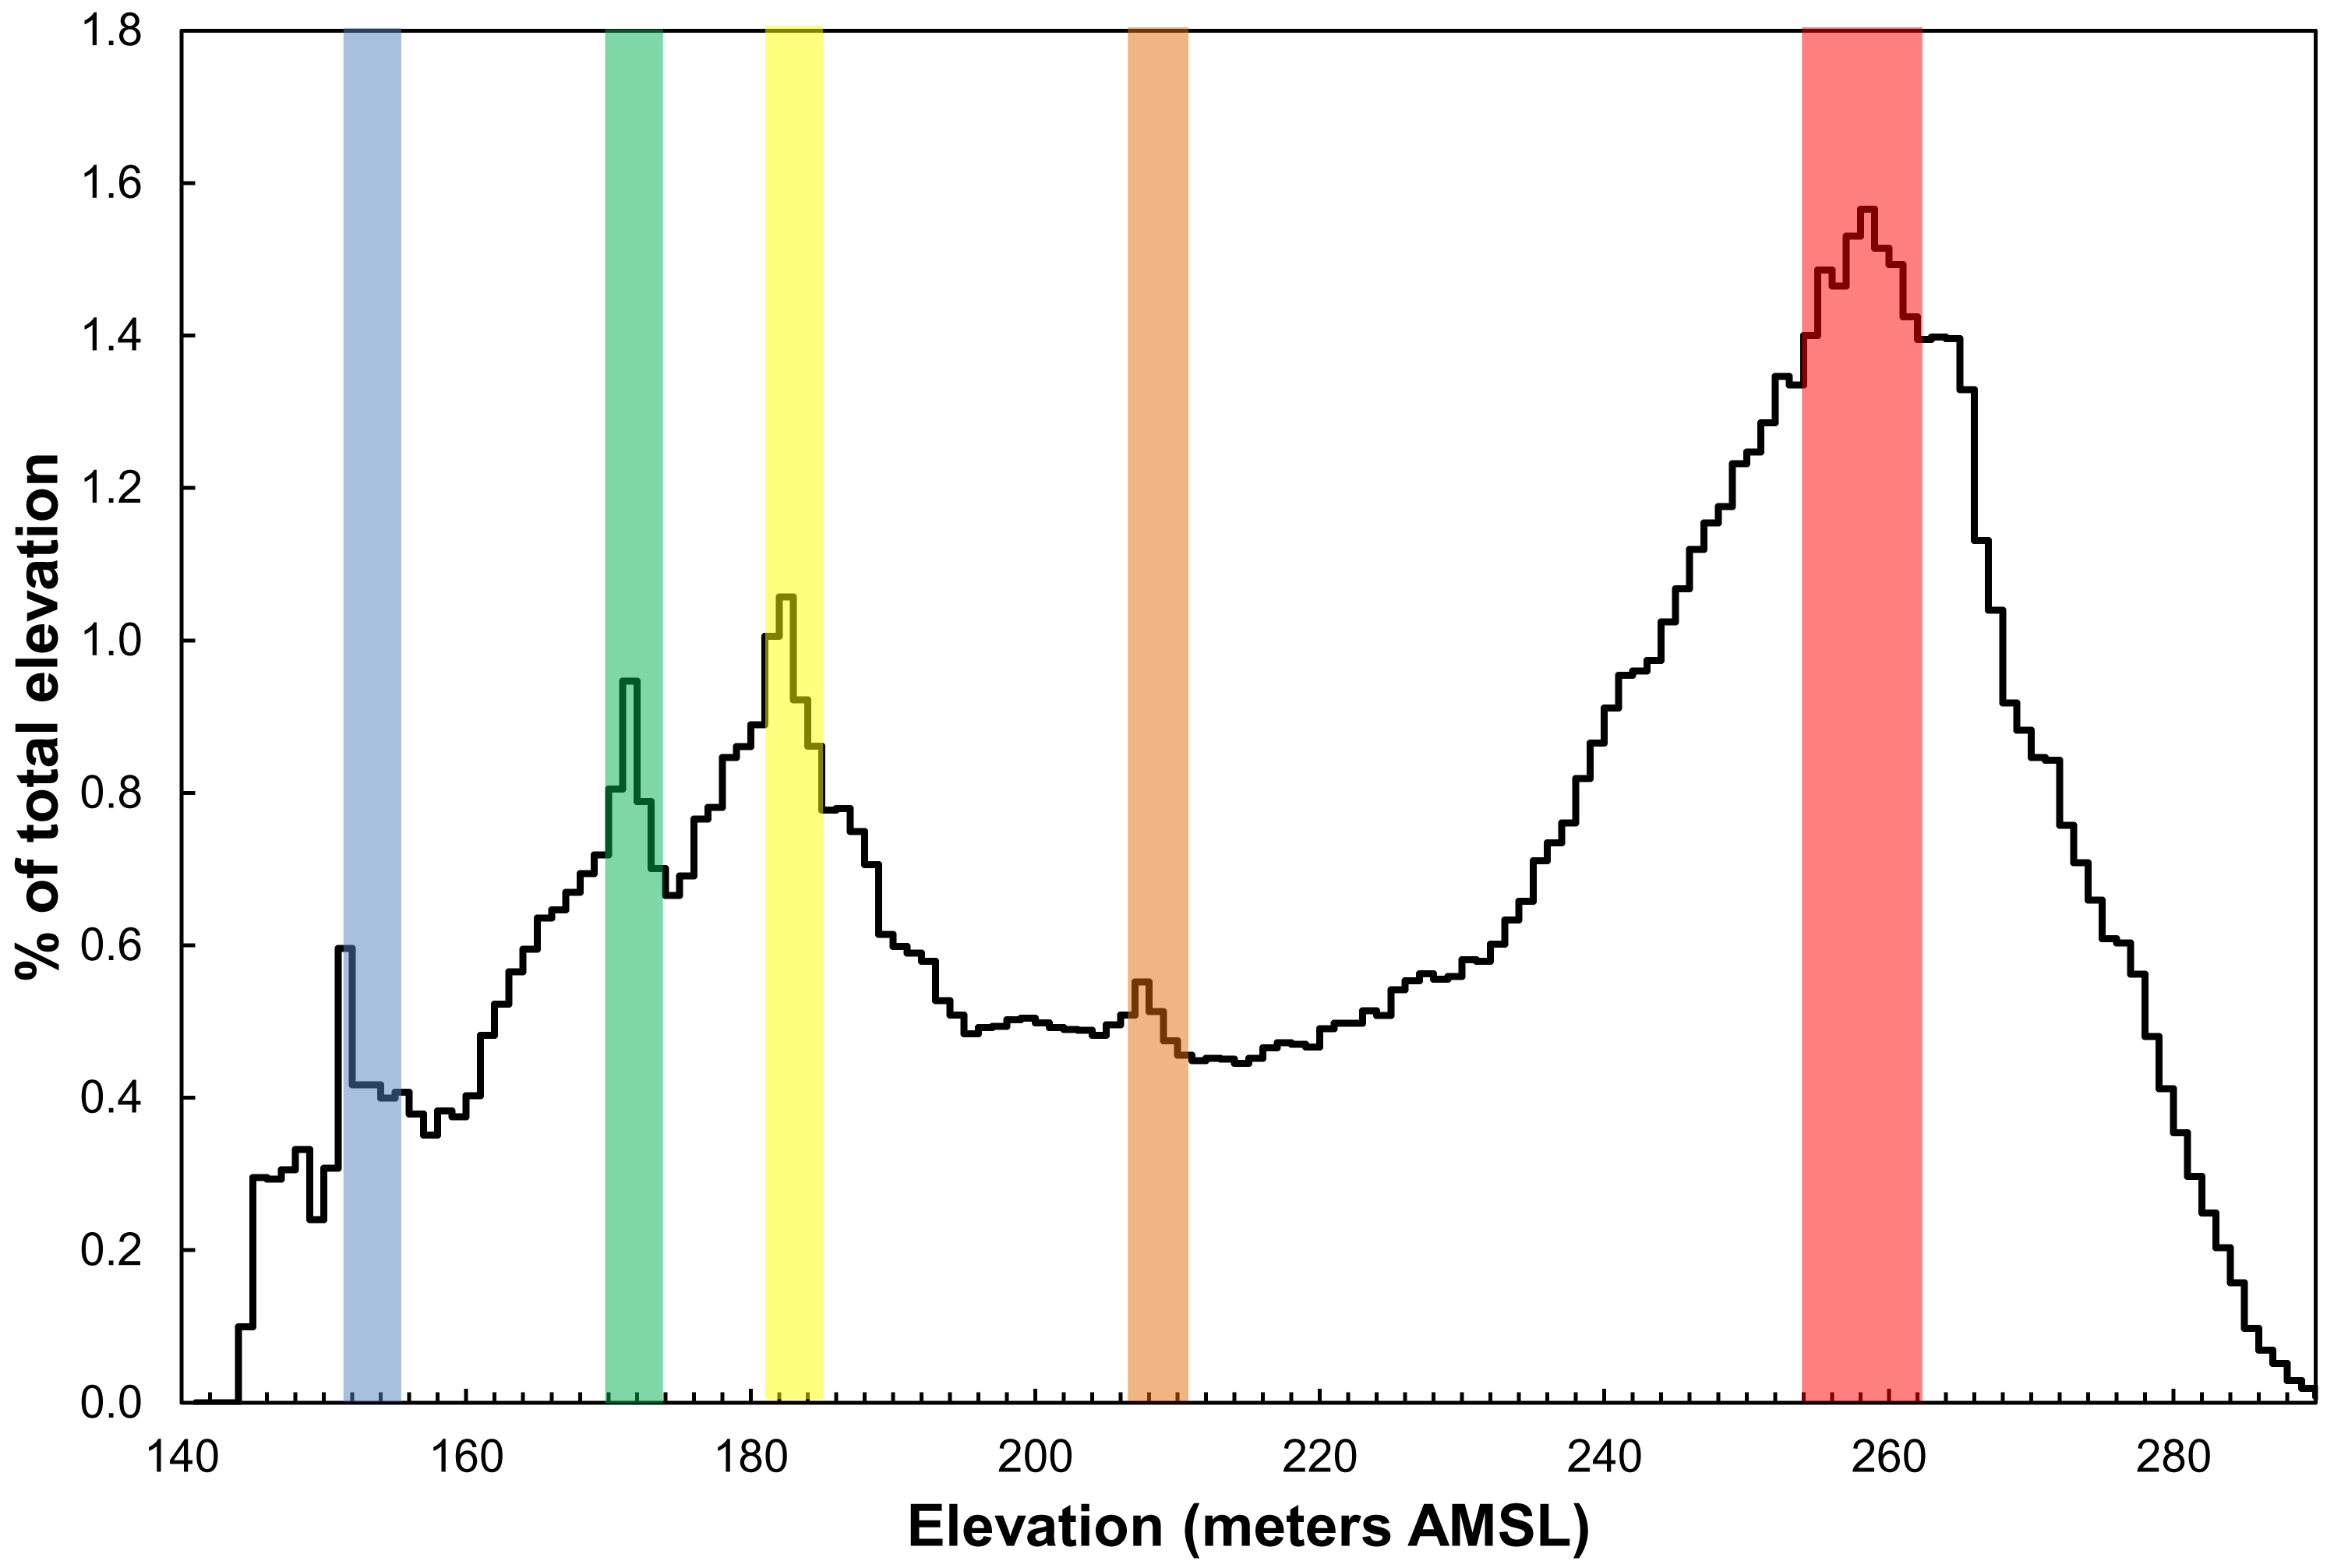
The data shown here were downloaded from the USGS National Map Viewer. The 1/9-arcsecond (~3.5m) DEMs of the Cincinnati East and Cincinnati West 7.5' quadrangles are produced from LiDAR imagery flown by the State of Ohio. The histogram below shows the percent occurrence of every elevation in both quadrangles as a percent of the total area. Each color refers to an elevation range: corresponding to a topographic bench (mode in the histogram):
| Color |
Elevation (meters above mean sea level) |
|
Blue Green Yellow Orange Red |
148-154 167-173 180-188 206-210 250-270 |
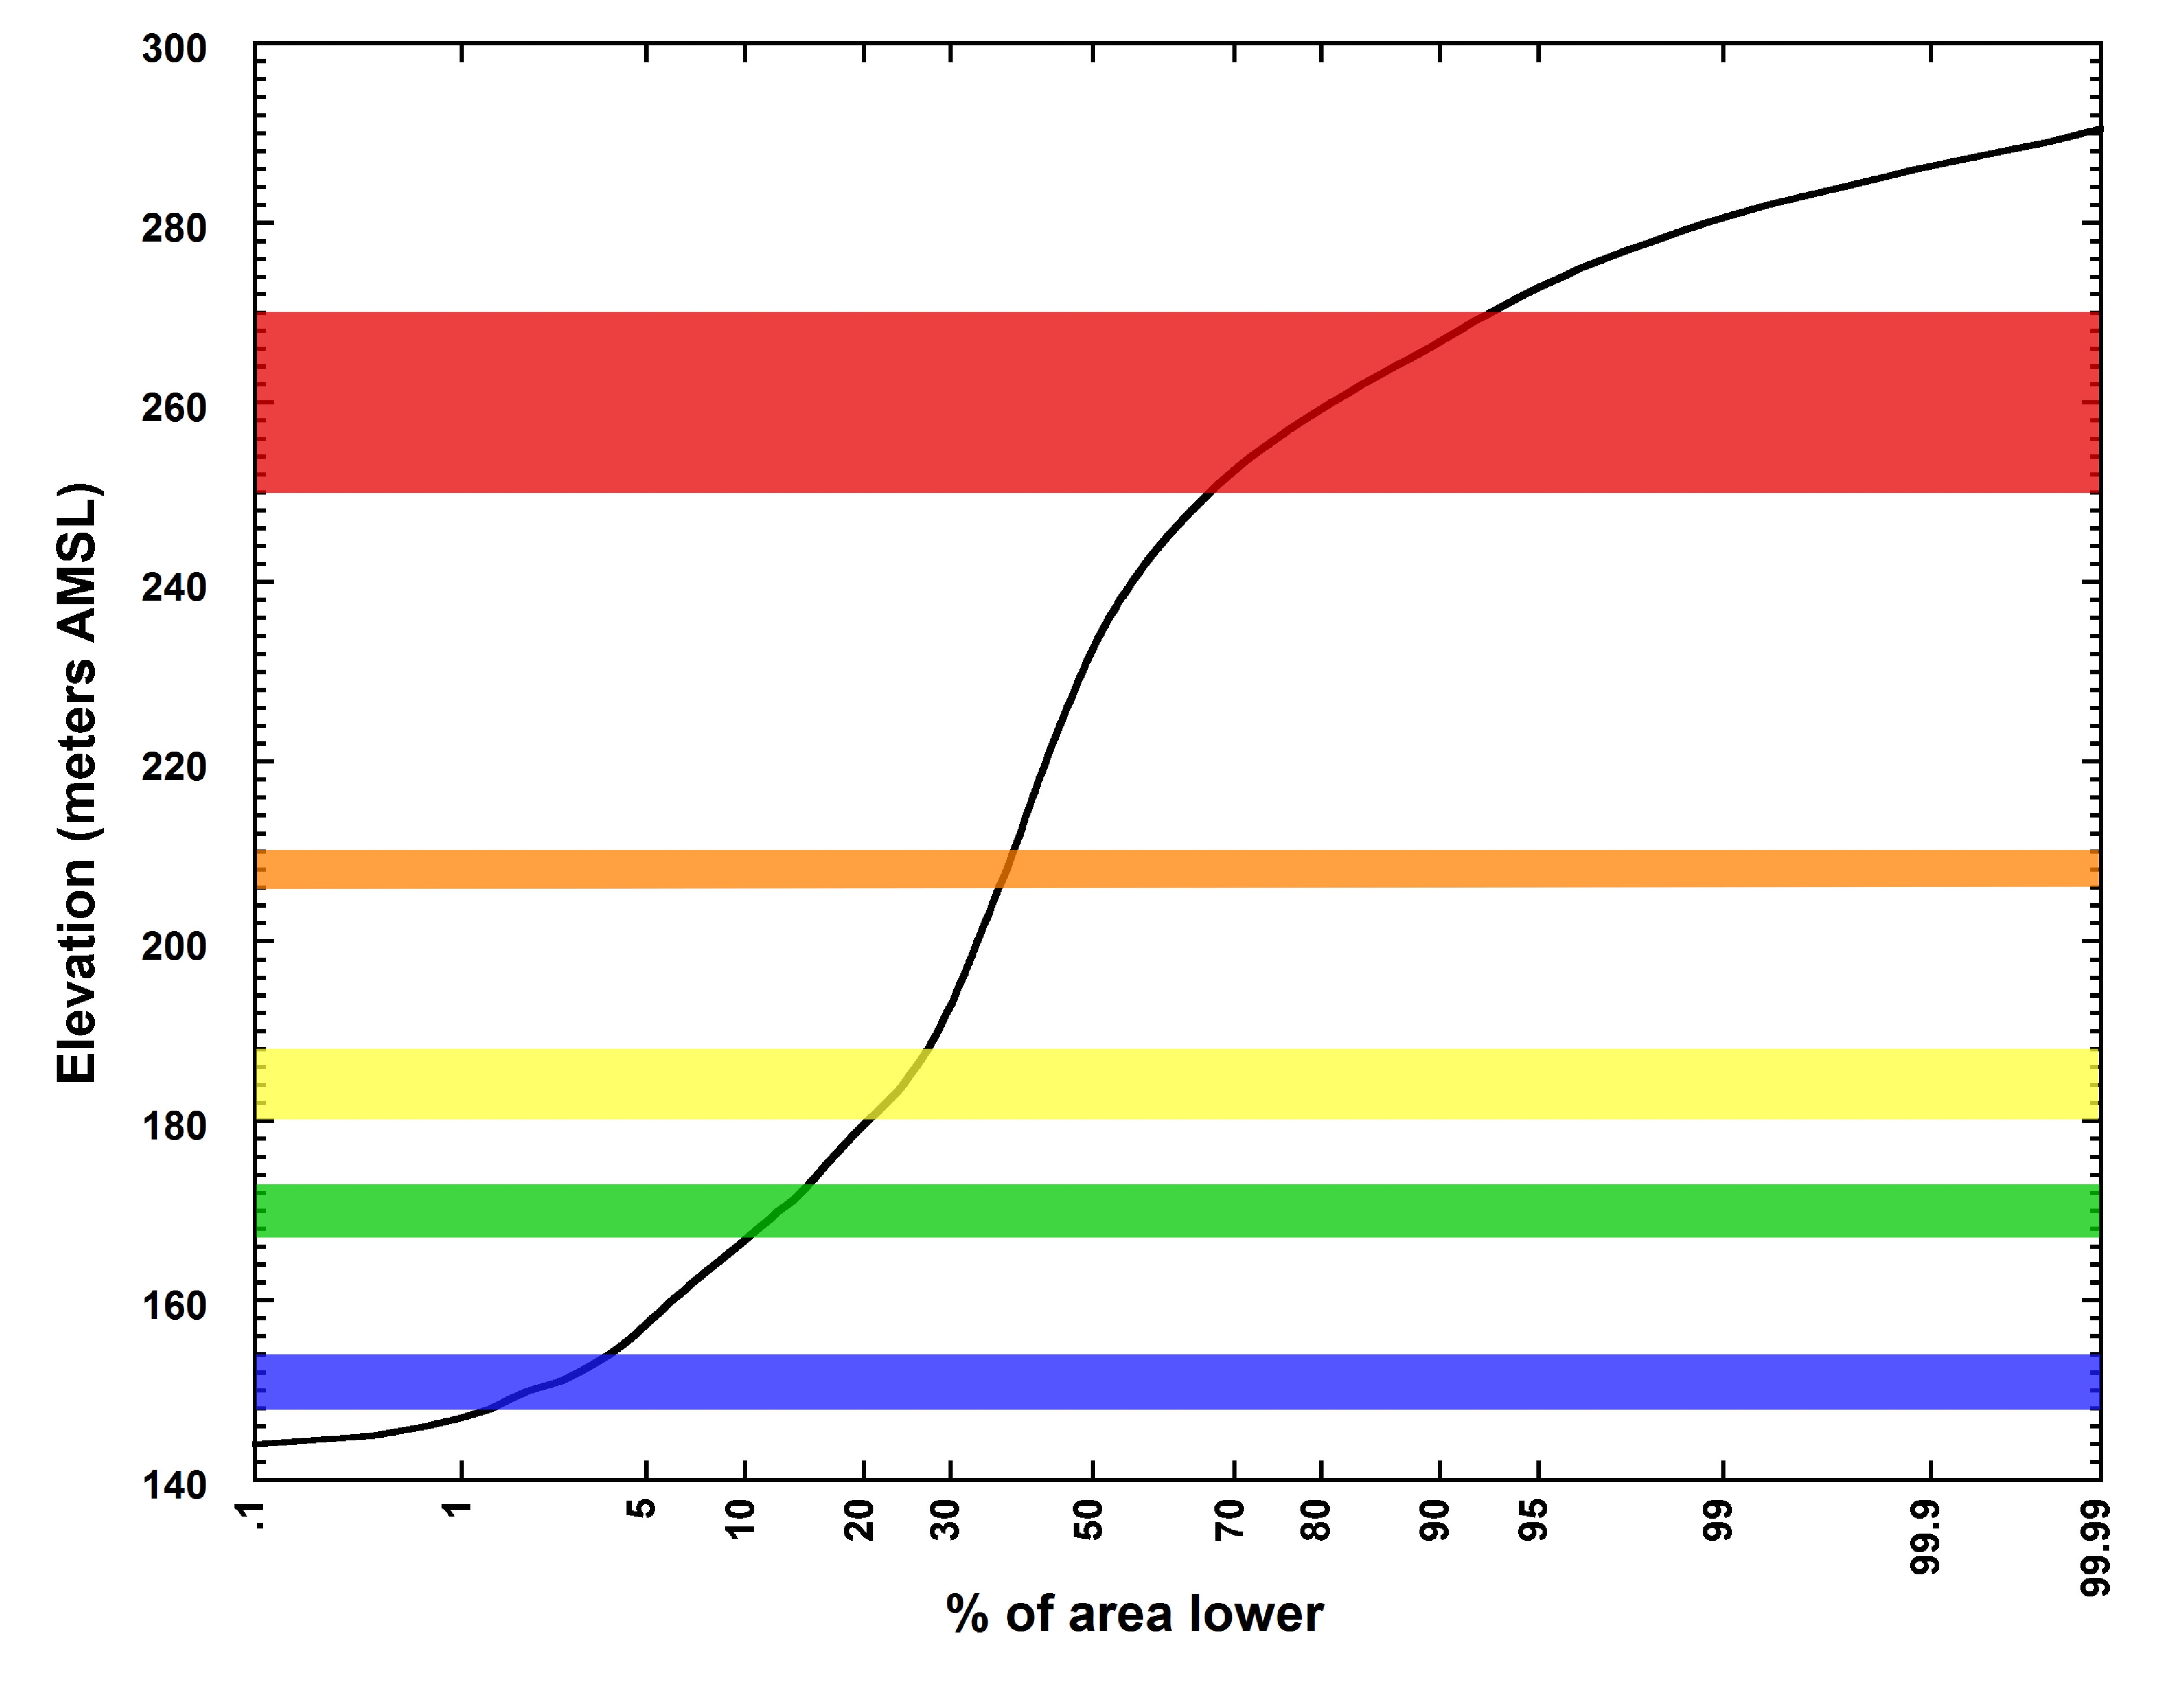
The hypsometric curve below shows the cumulative percent of the area of the Cincinnati East and Cincinnati West quadrangles below a given elevation.
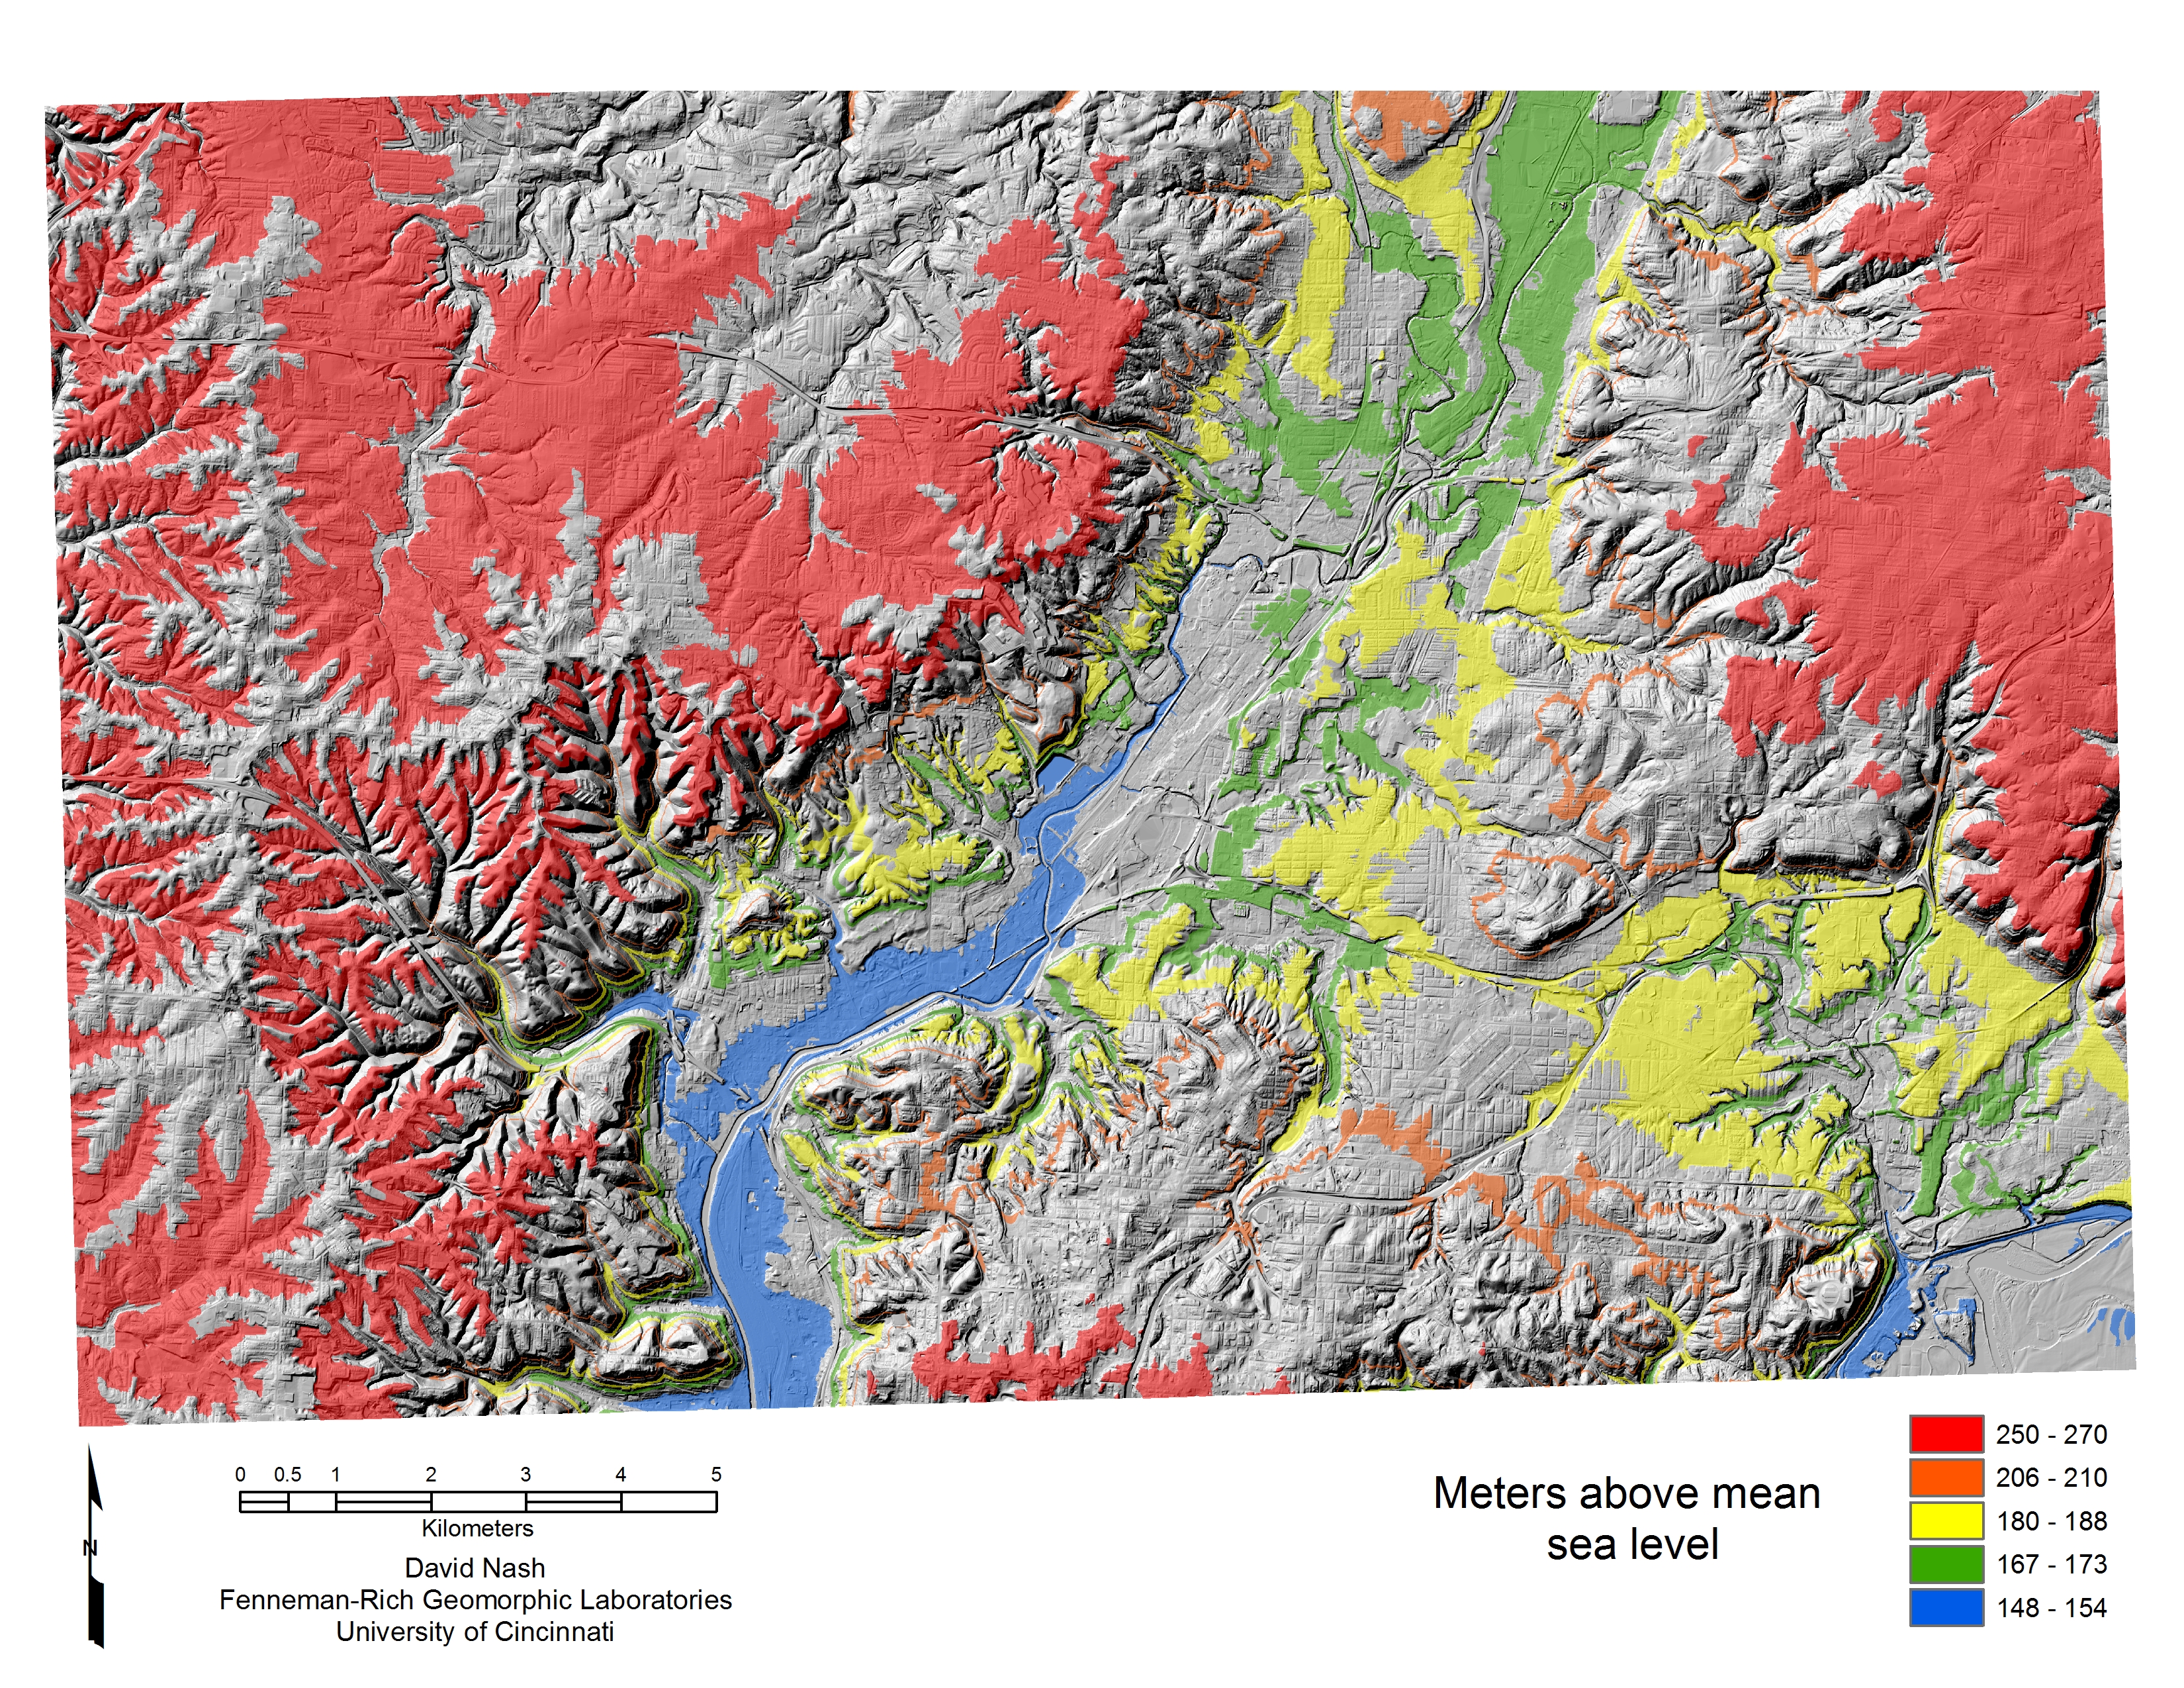
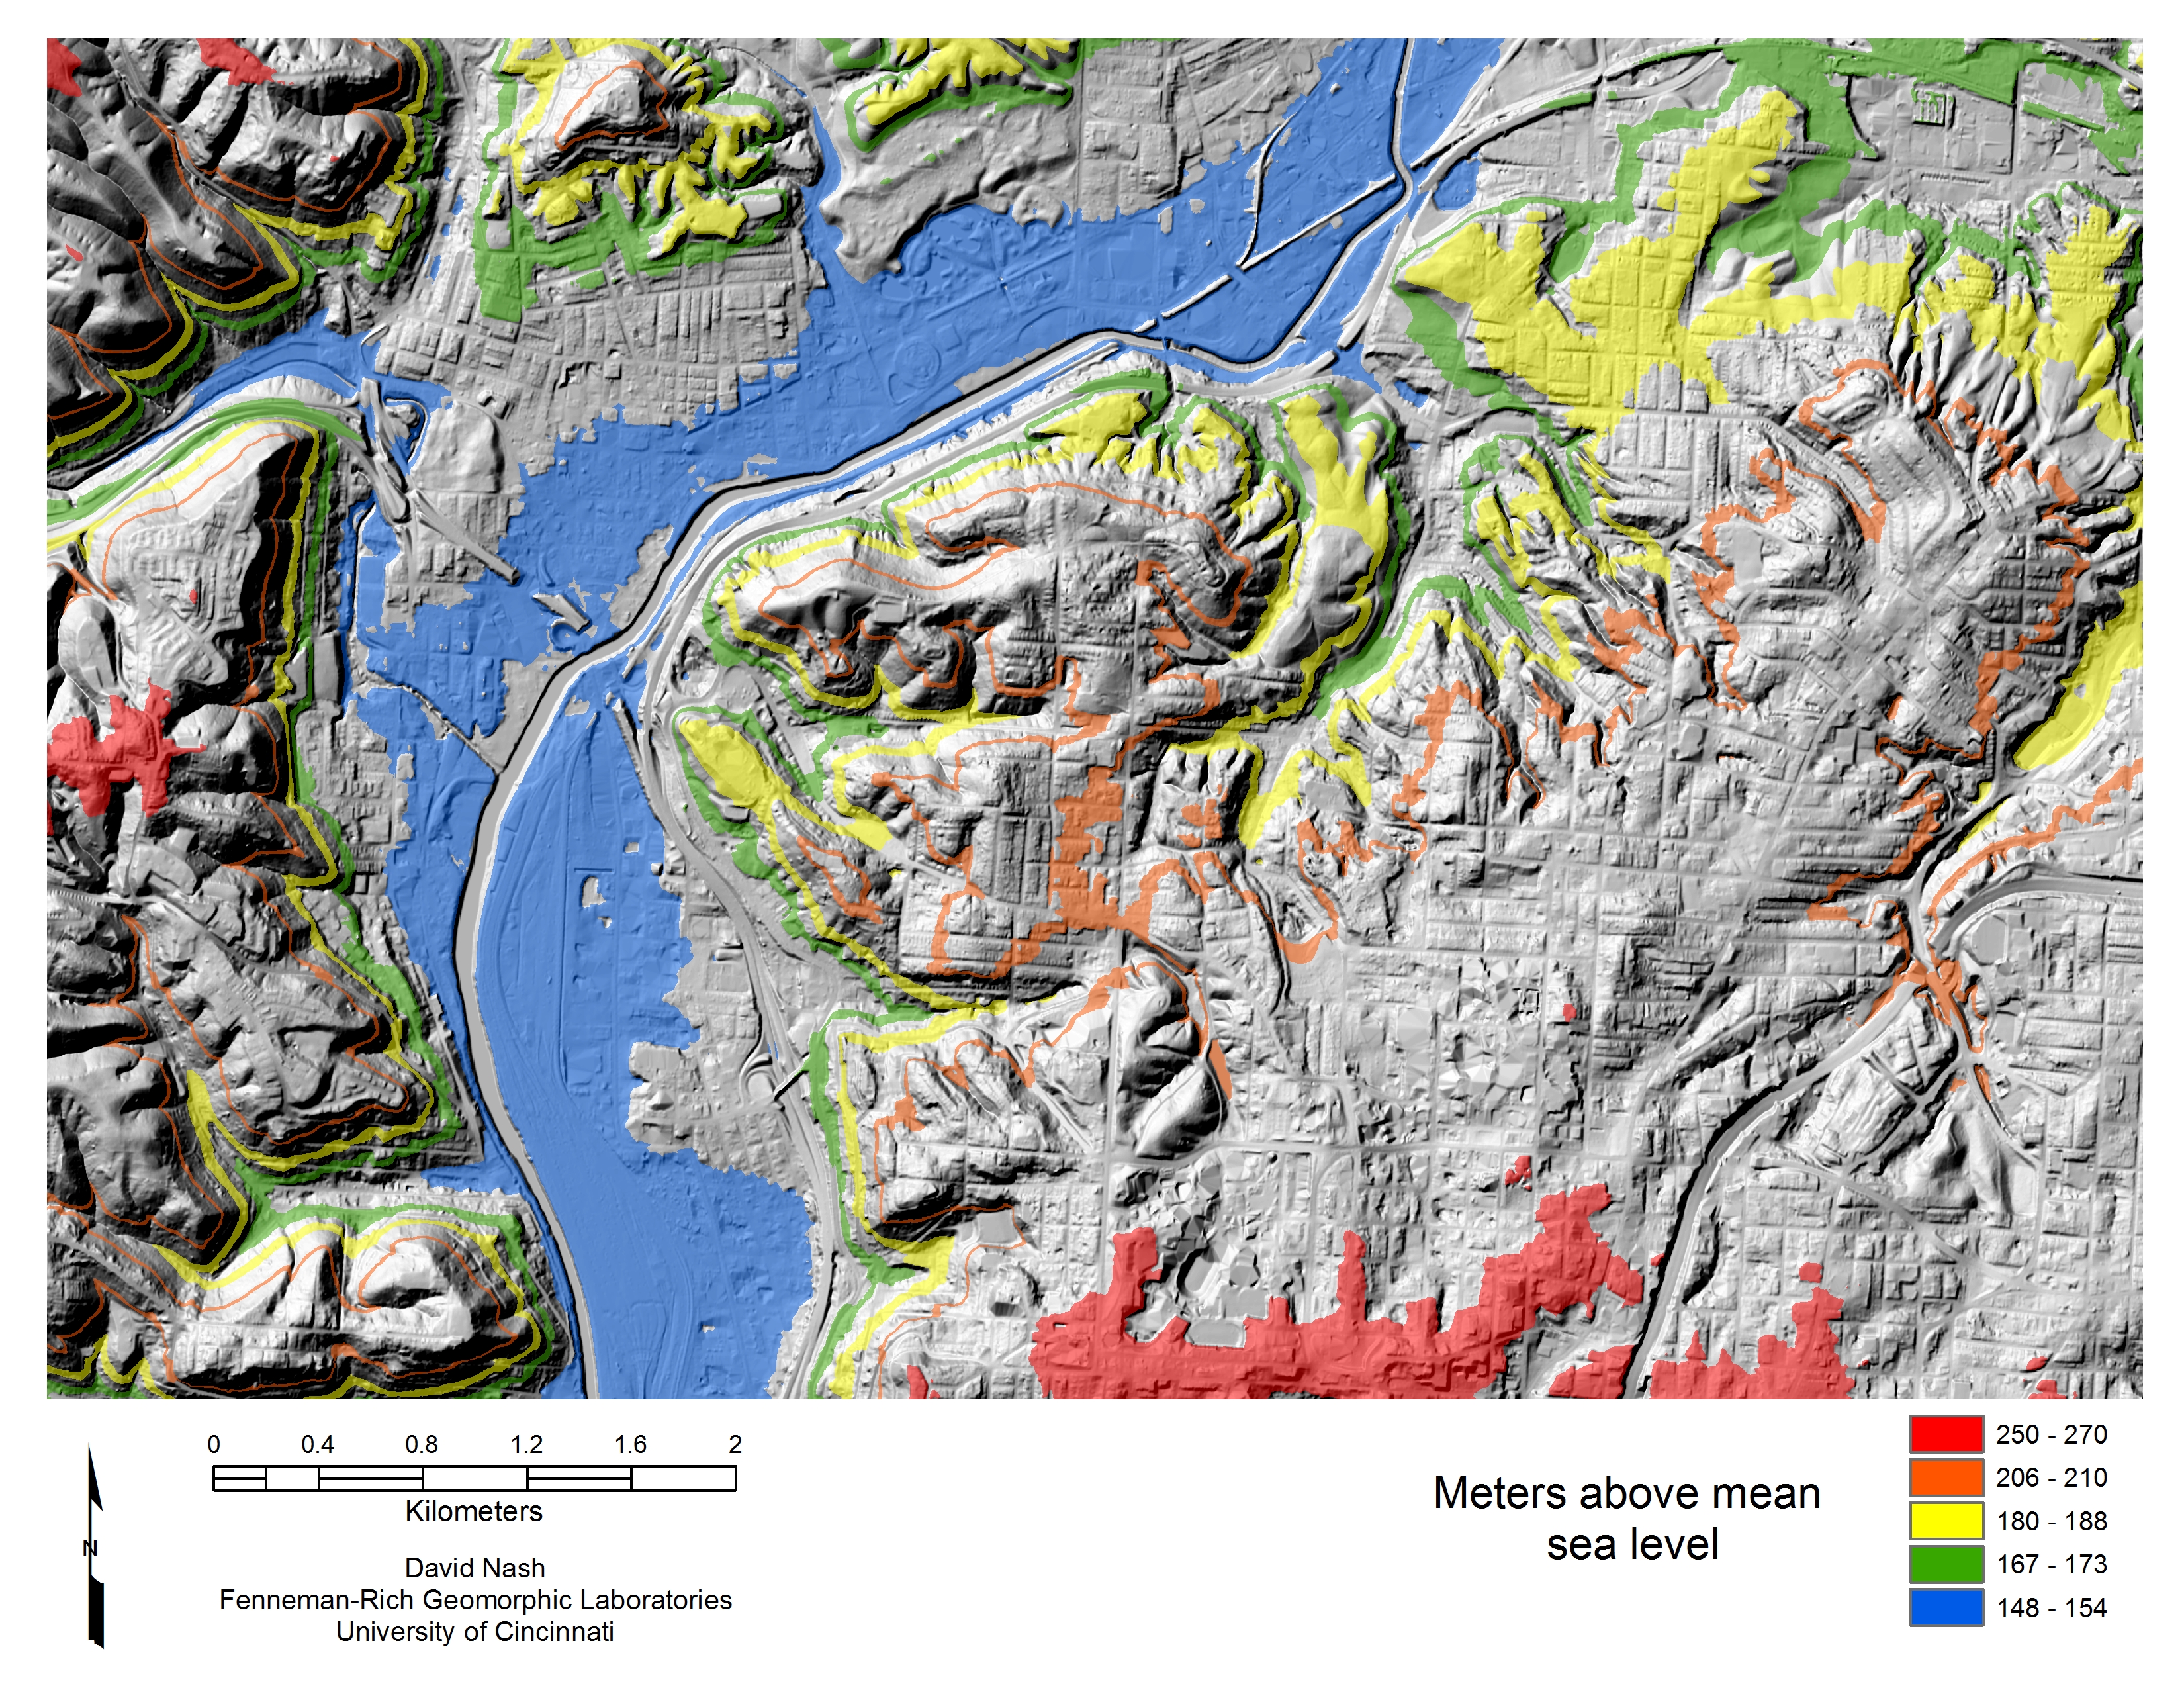
The ESRI hillshade (5x exaggeration) below was produced from the DEM of Cincinnati East and Cincinnati West quadrangles. Color overlay corresponds to the elevation ranges specified above.
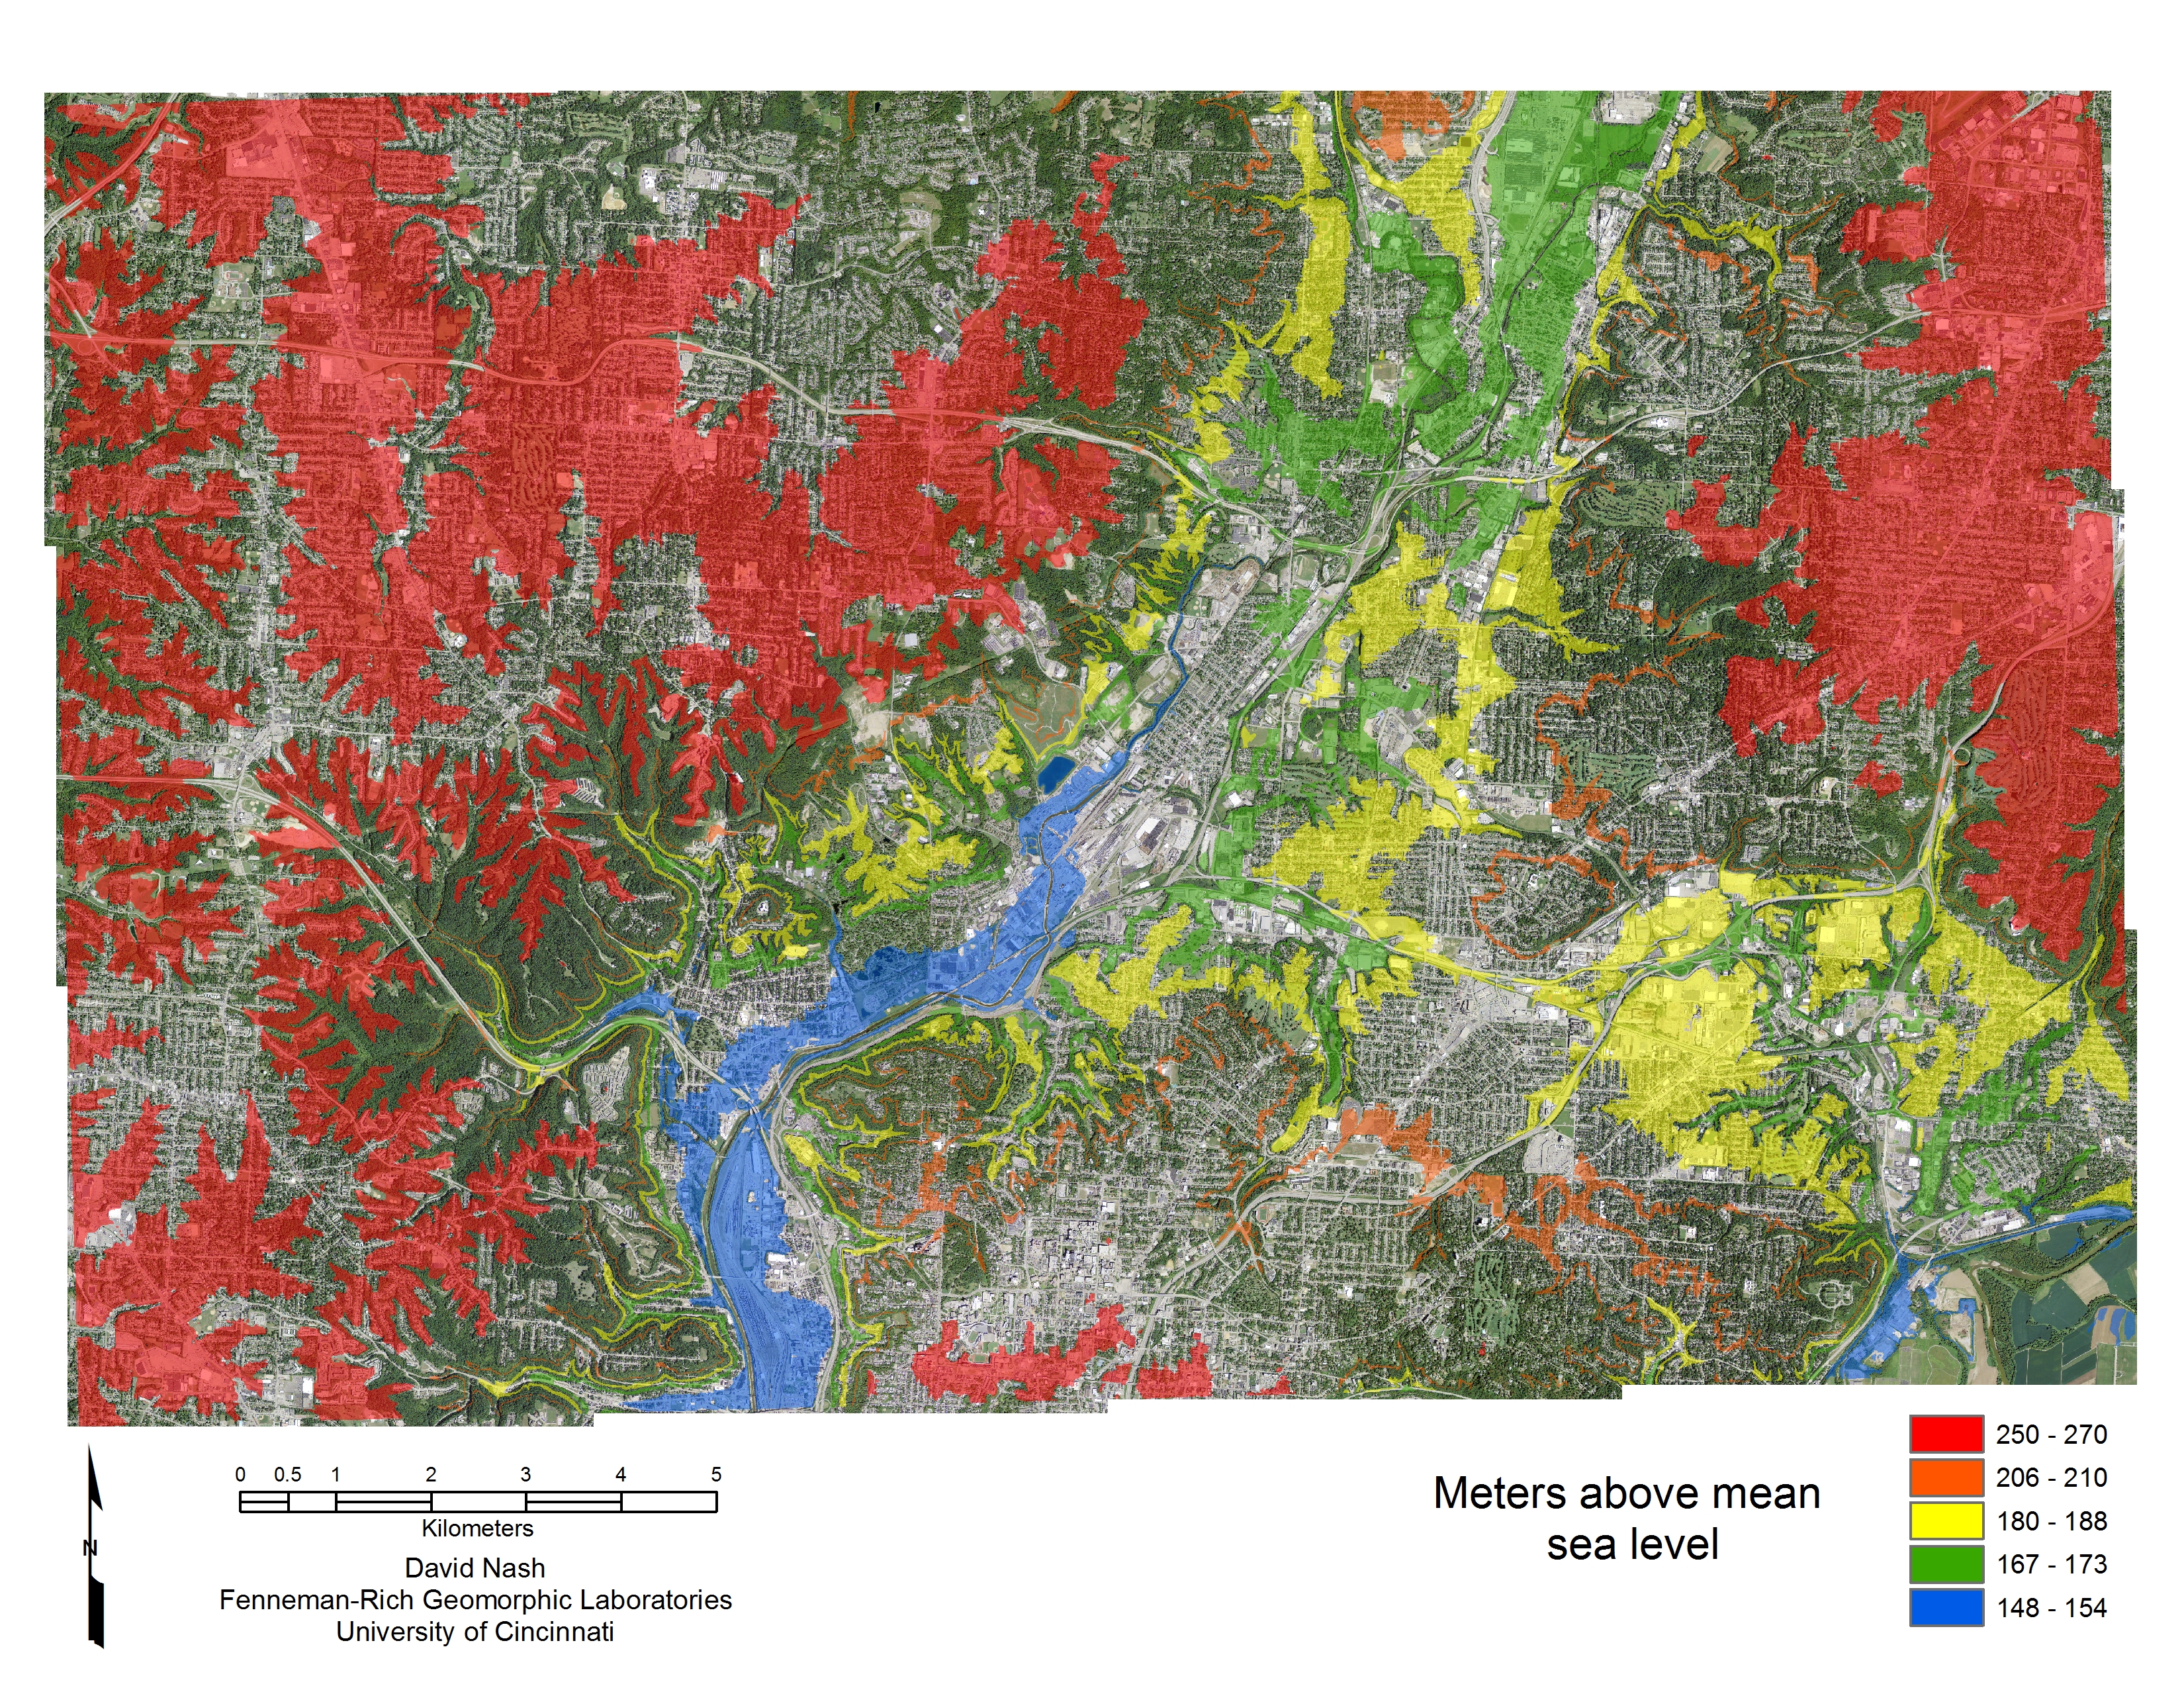
Air photo of the same area in the hillshade above is shown in the areal photography mosaic below.
The ESRI hillshade (5x exaggeration) below is a blowup of the environs of Clifton. The University of Cincinnati campus is near the middle by the lower edge of the image (football stadium clearly visible).
Air photo of the same area in the hillshade above is show in the areal photography mosaic below.
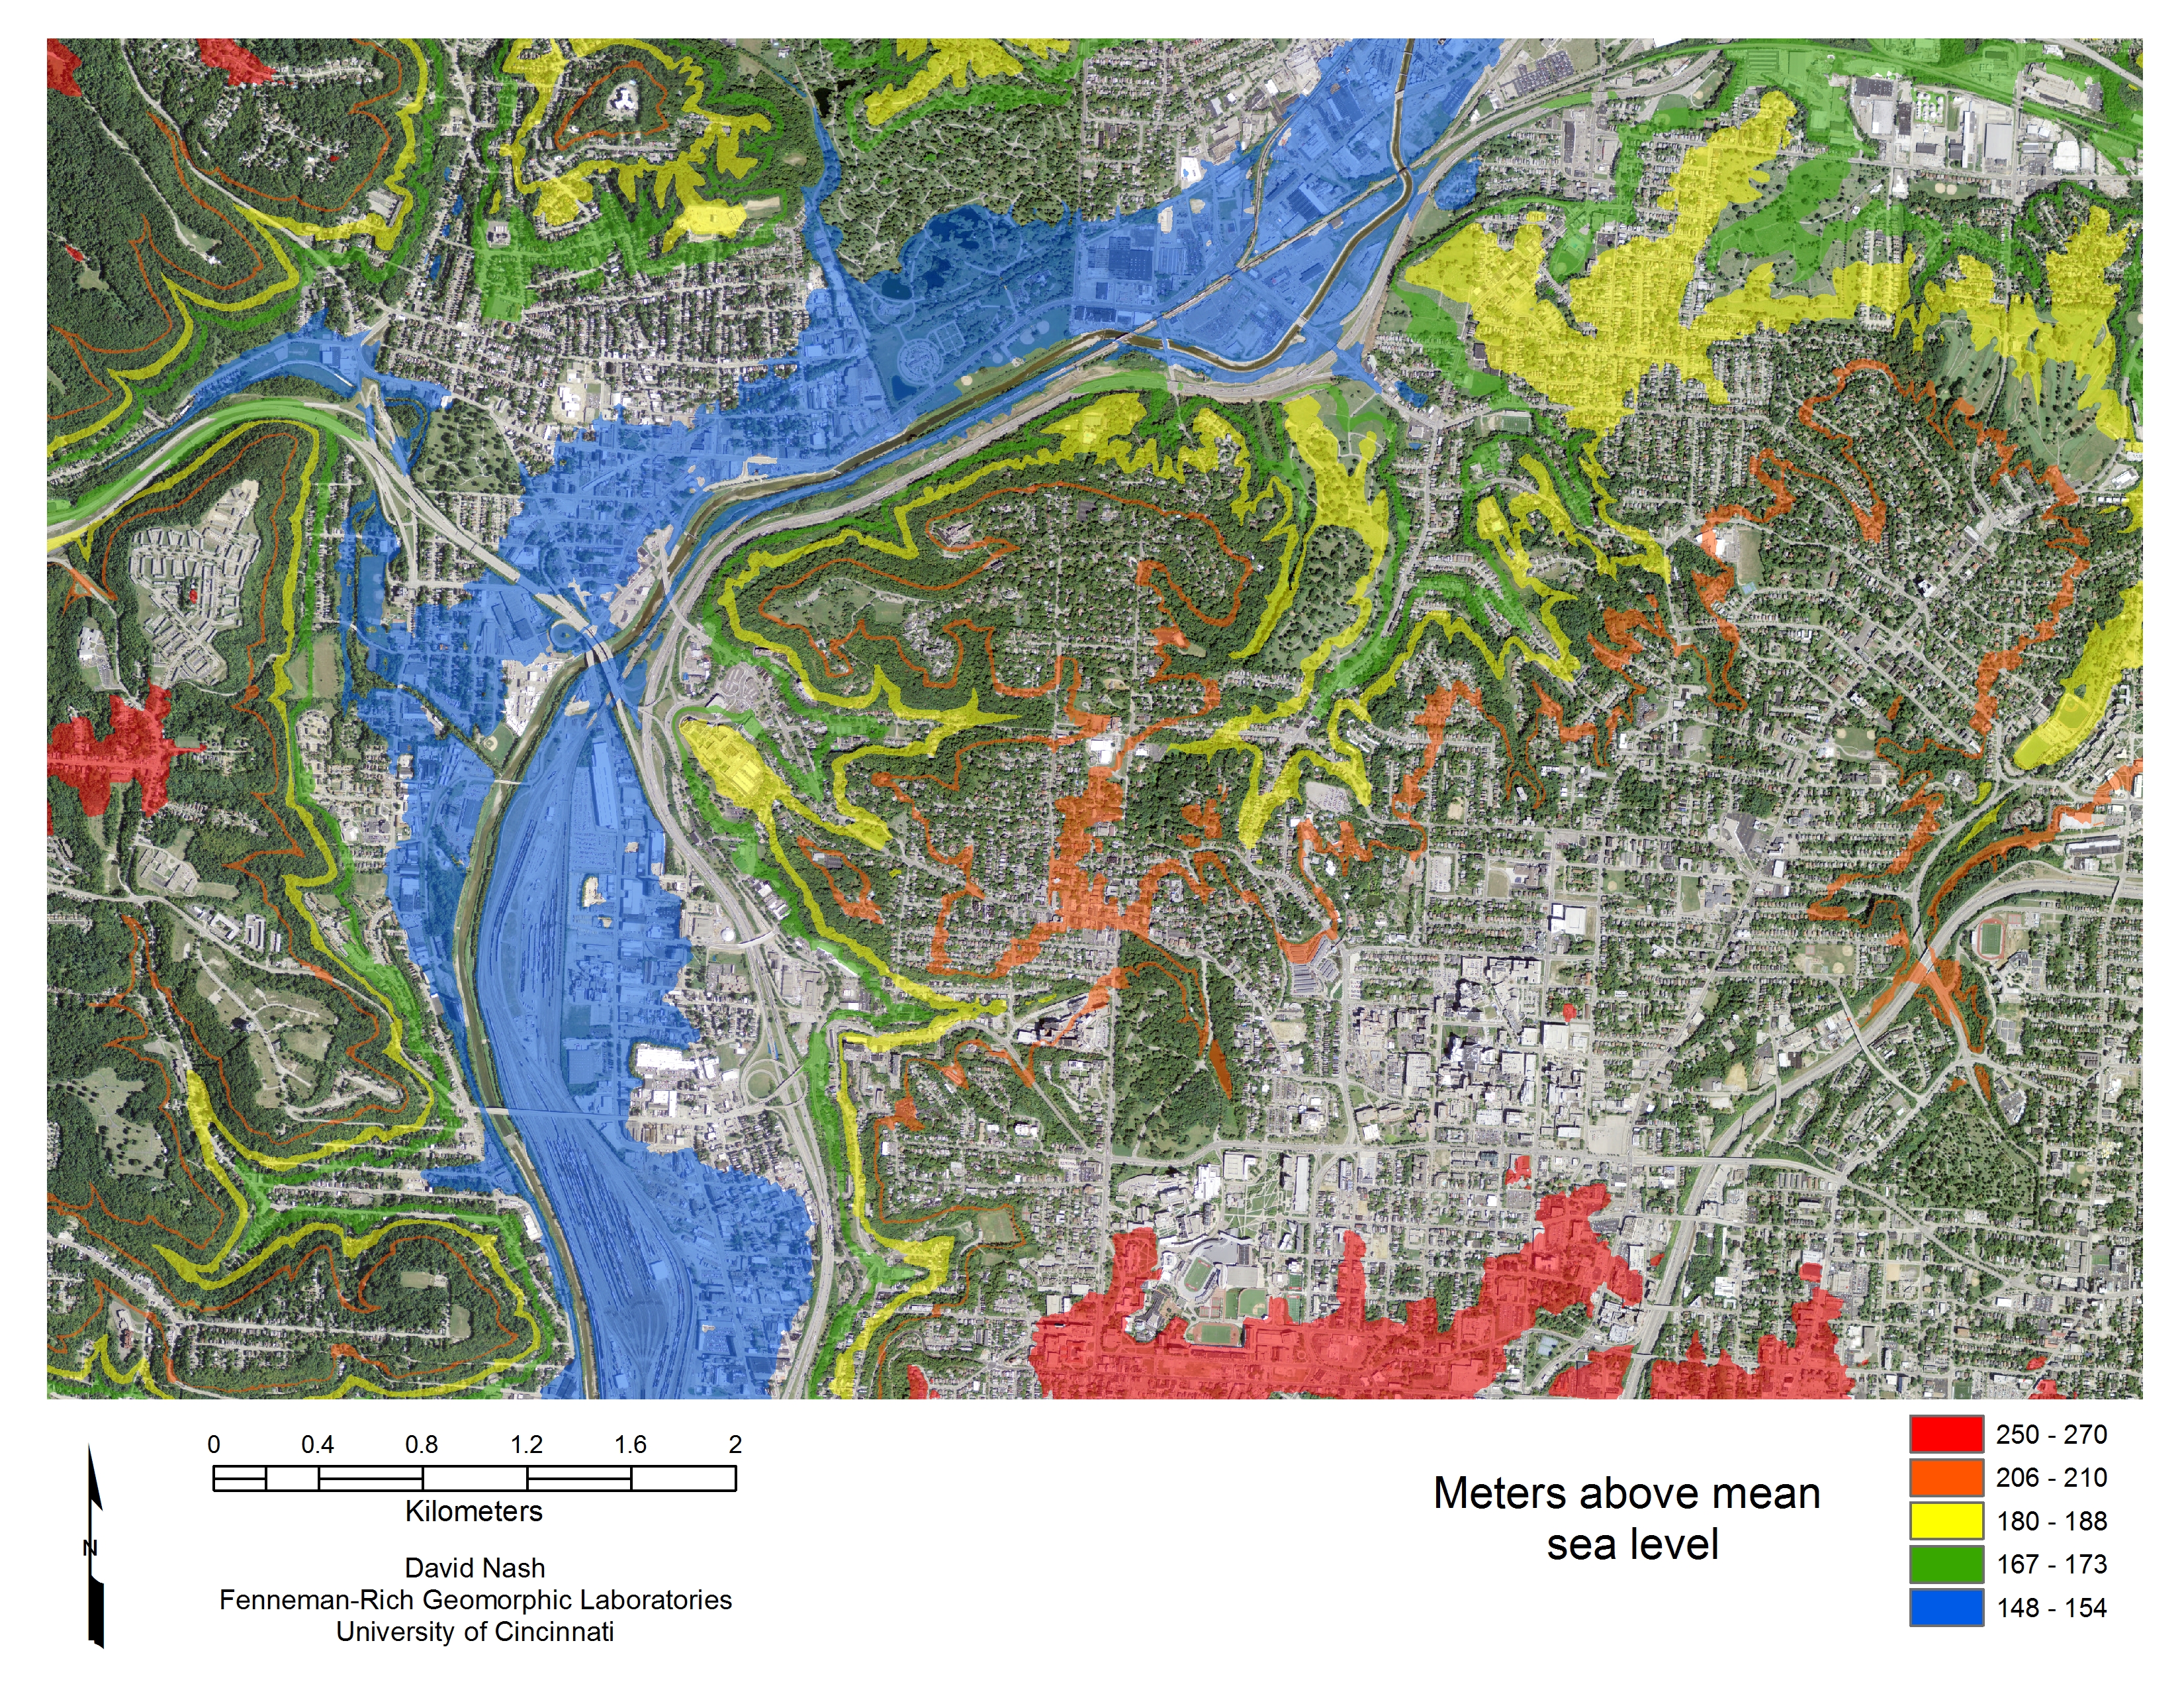
Blue corresponds to the modern floodplain of Mill Creek. Green may correspond to the Wisconsinan outwash terrace. Yellow may corresponds to the Illinoian outwash terrace. Orange corresponds to the outcrop of the Fairview Formation (possibly a result of hillside quarrying). Red corresponds to an undissected pre-glacial upland (perhaps the Lexington Peneplain).
All the the figures and images on this page are available in this pdf.