Reading a topographic map

This activity is designed to help you visualize landscape as represented by the use of contour lines. Contour lines are lines connecting points of equal elevation and are displayed in the form of what is called a topographic map. Topographic maps are published by both State and Federal agencies, generally the geological survey, and have been compiled at various scales for the entire united States and for most countries in the world.


1. First, review the three short tutorials entitled, Finding Your Way with Map and Compass, Where is the North Pole?, and Map Scales, then answer the following questions:

2. Next. learn about longitude and latitude here. Read the descriptions, then answer the following questions:
 
3. Now lets look at a topographic map of a well known area, Yosemite National Park in California.

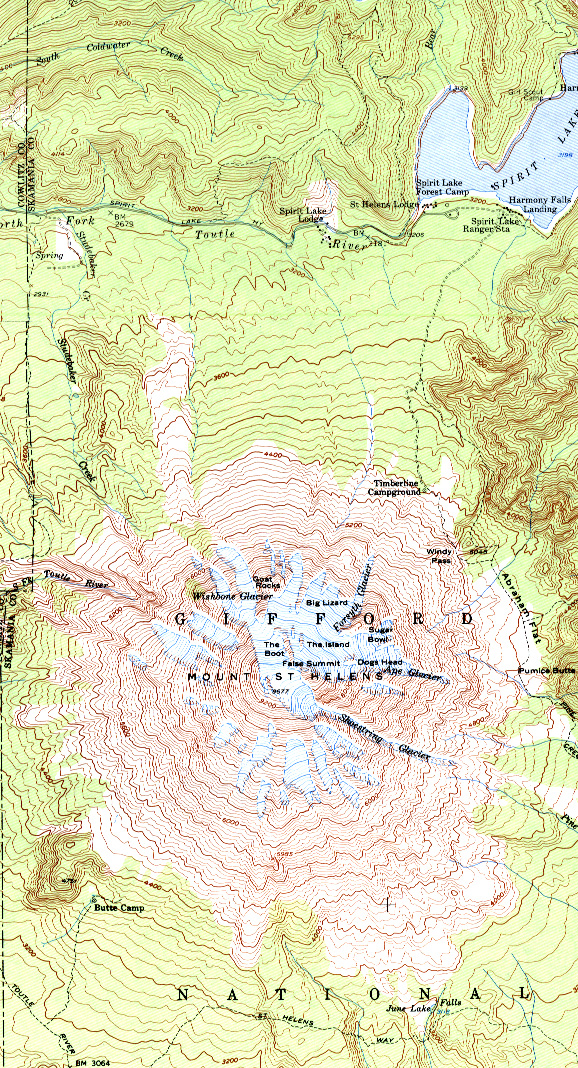
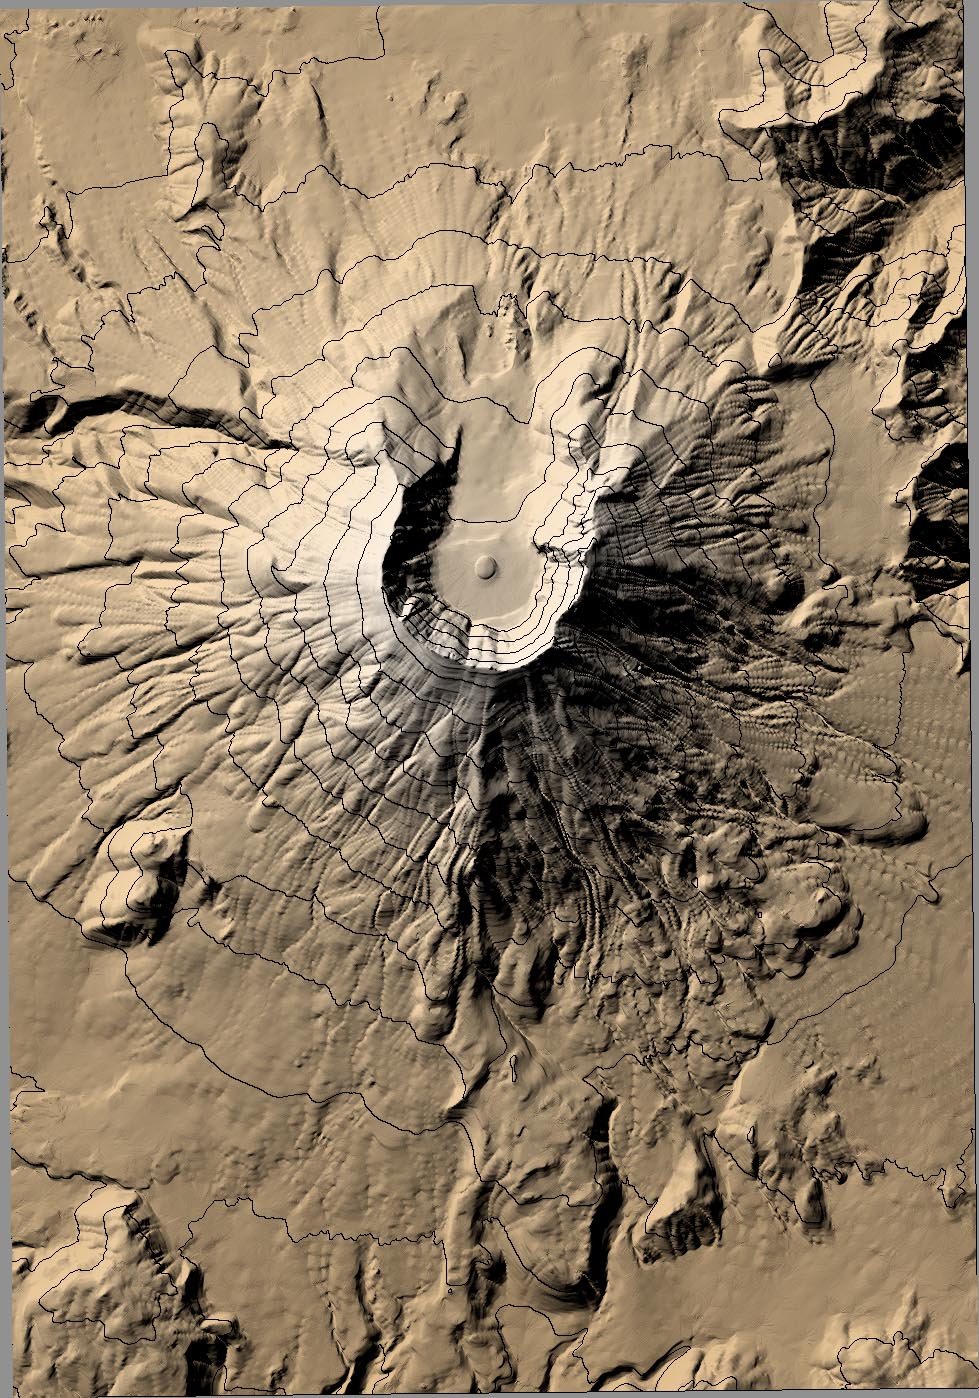
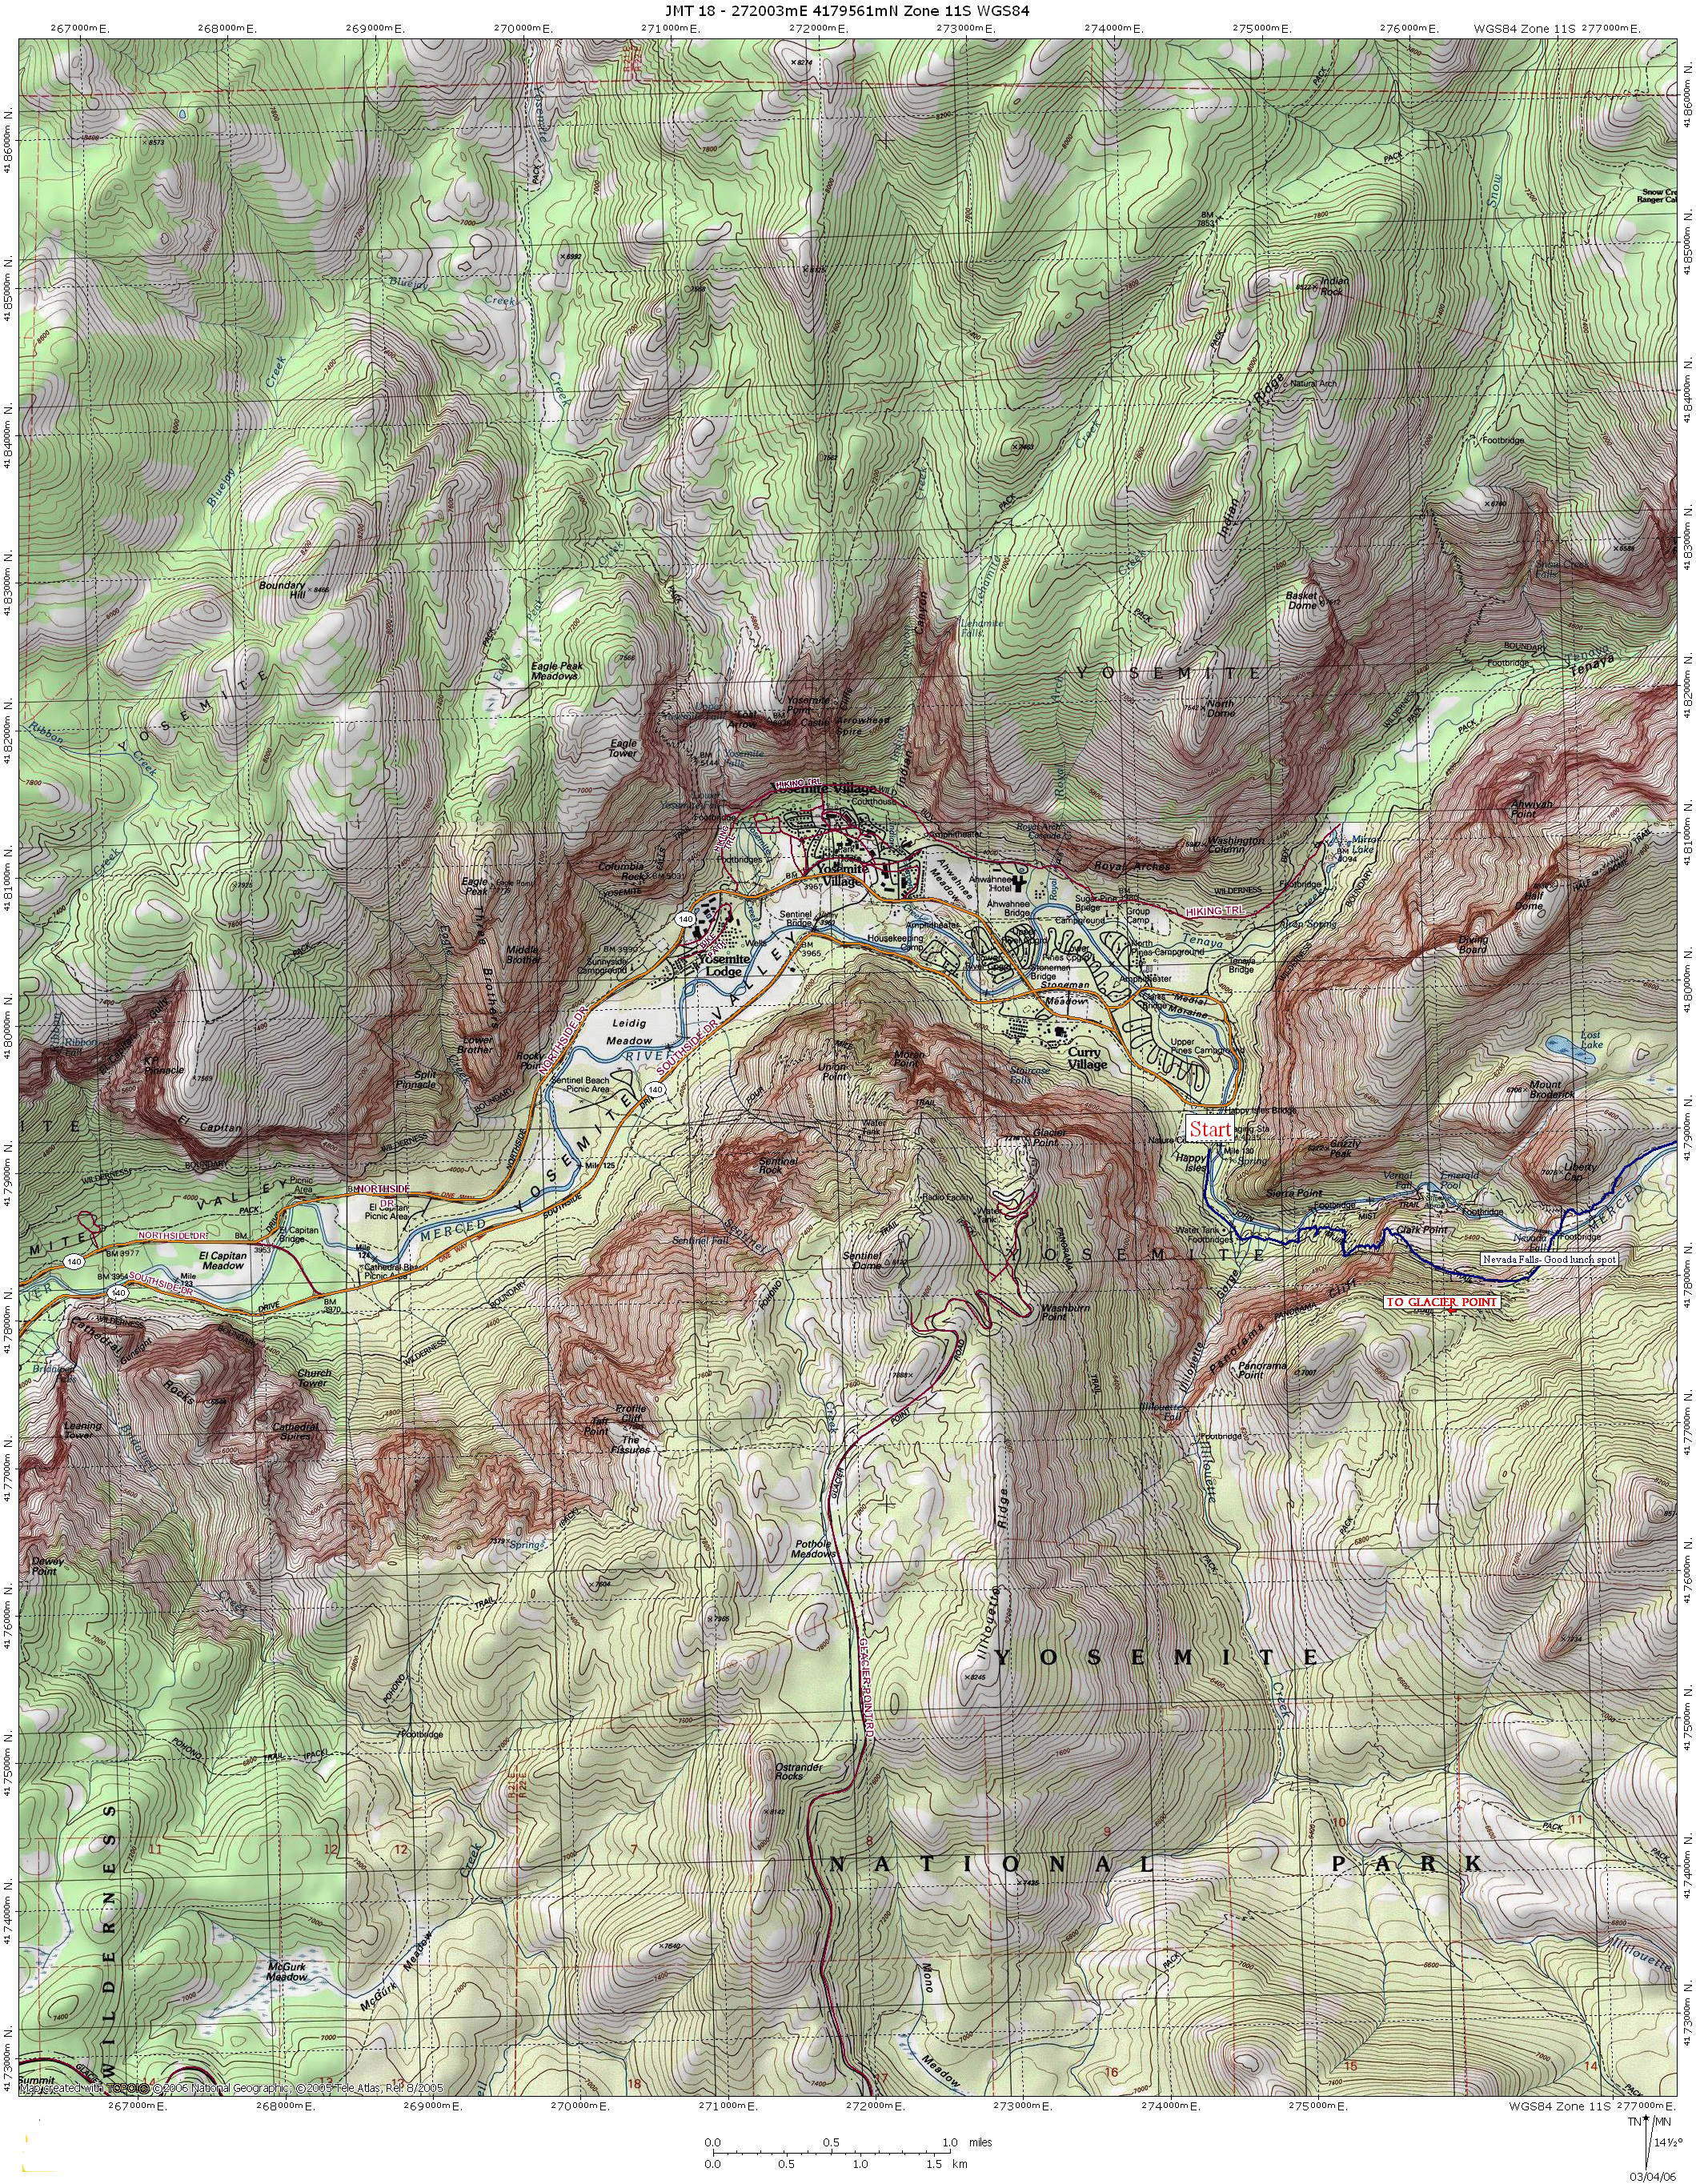
Click on this image to see a larger version. Note how the contour lines appear to wrap around the hills and valleys, giving the landscape the appearance of the third dimension.

Question: Elevation points located directly on a contour line are known precisely, but those between the contour lines are known only approximately. Why?

4. To give better visualization to this map let's look at it in 3D. Here are two images, one a stationary image and the other a Quicktime movie. In the stationary image notice the faint contour lines which define the basic outline of the landscape.
Question: The canyon makes several sharp bends. What do you think could account for this?
5. Now let's look at the contour lines by themselves (click for larger view). You will notice the fewer number of contour lines compared with the image above. That is because only the very essential lines have been retained in this image to show the basic landscape. We will construct a profile of the region along the landscape line by measuring the elevation at each point where the A-A' transect line crosses a contour. Additional data points representing land between the contours have been added to produce a more detailed view of the landscape. Download the data in an Excel file here and follow the instructions on the sheet for constructing a topographic profile.
Question: Relief is used to describe the elevation differences in an area; an area of rugged terrain has high relief, whereas a fairly flat area has low relief. Relief, then, is the elevation difference between the highest and lowest points in an area. What is the maximum relief in feet of the area?

6. Next, let's do a similar exercise with the Mount St. Helens quadrangle in Washington. Look at each of the images below and end by constructing a profile Excel

Quicktime Movie
Click for larger view
Topographic Map (Click for larger view)
3D Map (Click for larger view)

Question: What is the elevation difference in feet between the depth of the summit crater and the total relief of Mt. St. Helens?

Submit your answers by uploading them to the Assignments page by the due date announced in class.