Fossil Fuels

America’s appetite for energy as it industrialized was prodigious, roughly quadrupling between 1880 and 1918.  Coal fed much of this growth, while electricity expanded in applications and total use alike.  Petroleum got major boosts with the discovery of Texas’s vast Spindletop Oil Field in 1901 and with the advent of mass-produced automobiles, several million of which had been built by 1918.

In the years after World War II, “Old King Coal” relinquished its place as the premier fuel in the United States.  The railroads lost business to trucks that ran on petroleum and also began switching to diesel locomotives themselves.  Labor troubles and safety standards drove up coal production costs.  The declining demand for natural gas as an illuminant forced that industry to look for other markets.  Heating applications had obvious potential, and natural gas replaced coal in many household ranges and furnaces.  The coal industry survived in part because nationwide electrification created new demand for coal among electric utilities despite regional competition from hydroelectric and petroleum-fired generation.

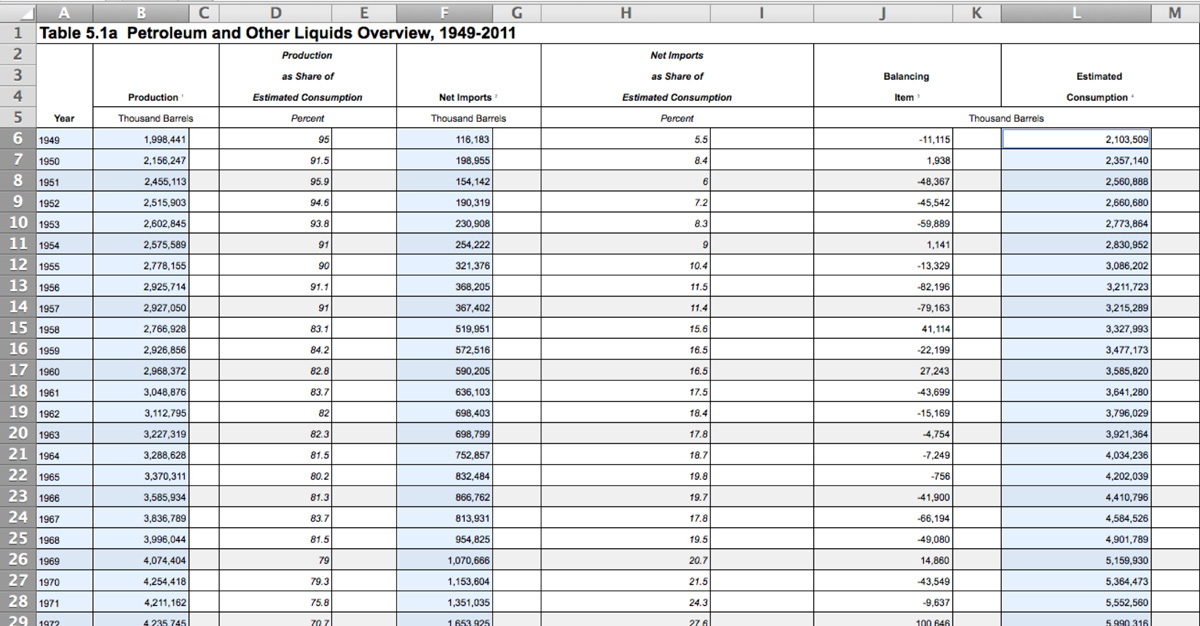
Most energy produced today in the United States, as in the rest of the industrialized world, comes from fossil fuels—coal, natural gas, crude oil, and natural gas plant liquids.   Although U.S. energy production draws from many sources, fossil fuels together far exceed all other forms.  In 1999 they accounted for 80 percent of total energy production and were valued at an estimated $94 billion. This exercise is designed to look first at coal and its occurrence, and then at petroleum production, consumption, and importation in the U.S. between 1949-2011. For additional background information read Energy perspectives: 1949- 2011 and also study this chart of US energy consumption since 1775. Then proceed with this exercise.

Part 1: Coal

Go to Coal: An introduction and find the answers to the following questions.
  1. What are mires and how are they classified?
  2. Physico-chemical coalification is caused by conditions of __________.
  3. The smallest microscopically recognizable entities in coal are called ________.
  4. What is vitrinite?
  5. What can vitrinite reflectance data be used for?
  6. What are lithotypes?
  7. _________ is the most desirable maceral group, since it contains more hydrogen and oxygen.
  8. What are the most abundant minerals in coals?
  9. What is coal rank?
  10. What is inherent ash?

Part 2: Petroleum

1. Go to the Annual Energy Review section on Petroleum and Other Liquids and download Table 5.1a entitled, "Petroleum and Other Liquids Overview, 1949-2011" in Excel format. The file will be called stb0501a.xls.
2. Four columns are of interest:
        A = YEAR
        B = PRODUCTION, which is the total amount of domestic petroleum produced in the U.S.
        F = NET IMPORTS, which is the amount of foreign oil imported minus the amount exported.
        L = ESTIMATED CONSUMPTION, which is the total amount of petroleum consumed in the U.S.
        ALL NUMBERS ARE IN THOUSANDS OF BARRELS
3. Now make a scatter plot of these four columns. Select and hold the cell with first year of record (1949) and drag all the way to the bottom cell (2011) and release. All years should now be selected.
4. Answer the following questions:
 
  1. Describe the general trends of U.S. production, consumption, and importation of petroleum over the period of record.
  2. What was the maximum amount of U.S. production, U.S. consumption, and importation of petroleum and when did each occur?
  3. When did imports of foreign petroleum exactly equal domestic production?
  4. Which has a more direct impact on total U.S. consumption of petroleum, foreign imports or domestic production? What is the basis for your answer?
  5. On the basis of this record, and your knowledge of domestic and commercial patterns of consumption of petroleum, what predictions can you make for these three categories over the next 50 years?
  6. What do you think might account for the apparent drop in consumption and importation during the 70's and early 80's? Why did these trends reverse themselves? (Hint: Look at http://cr.middlebury.edu/es/altenergylife/70's.htm)
  7. If you were in charge of a national energy program what policies would you recommend with regard to exploration and development of petroleum resources in the future? What are the principal concerns affecting such policy decisions?
Turn in your results, including the Excel chart, through the Assignments page on Blackboard by 5:00 pm on the due date.