

The following are tips on how I use these images in my classes to illustrate the nature of various light sources. If you do not have access to a fiber optic spectrometer to perform the demonstration yourself, you can click on the thumbnail images to download a high resolution version to use in your classes.
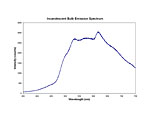
I start by showing an ordinary incandescent light bulb. The spectrum will look familiar to the students since it is a complete rainbow. I then show them the graph of intensity vs. wavelength to point out how we can look at the spectrum in a more quantitative way. I point out to them that the violet light on the left corresponds to the low wavelengths on the graph, and the red light at the right corresponds to the high wavelengths. Just like the numbers on the x-axis of the graph, the positions of the various colors won't change in upcoming spectra.
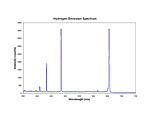
Hydrogen is a simple example of a line source. There are only certain colors of light in the spectrum. The exact wavelengths of the lines can be measured from the graph. At this point, I generally go to a lesson about atomic spectra. The other light sources below provide interesting examples, and they can be used in lessons about lasers and solid-state devices.


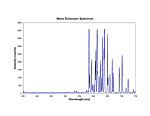
Once students understand atomic structure and its relationship to the color of emitted light, they can be shown the various colors of the noble gas emissions. Neon is interesting because it is predominately red. In fact, "neon" signs with tubes in colors other than red don't actually contain neon gas. See the complete list of spectra for the other noble gases.


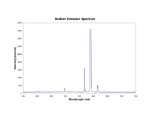
The line spectrum of sodium is interesting because students may recognize the color from sodium street lamps. The bright yellow-orange color of these lamps comes from the intense emission of a pair of lines at 589 nm. Low-pressure sodium lamps are very efficient, so they are often used in outdoor lighting situations where electricity costs must be kept down and the color of light doesn't matter.
The images below show (from left to right) the bulb, the spectrum of the bare bulb, the spectrum taken with a 1 mm slit between the bulb and camera, and the emission intensity graph recorded with the Ocean Optics spectrometer. Neither the camera/slit combination nor the spectrometer have sufficient resolving power to separate the two lines of the doublet.


Low-pressure sodium lamps require special fixtures containing a ballast. High-pressure sodium lamps (which often screw into standard light fixtures) are not suitable for this demonstration, since the high-pressure bulbs produce a continuous spectrum rather than the line spectrum of interest. If a low-pressure sodium lamp is unavalailable, the following reference suggests an alternative method for demonstrating the sodium emission spectrum:
The images below are of a spiral compact fluorescent bulb made for use in a standard light socket. Phosphors on the inner surface of the tube broaden the emission lines of the gas. The broad emission peaks correspond to images of the bulb in the primary colors, which produce white light when added together.


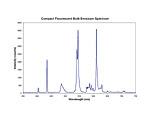
For a description of how fluorescence works and a lab activity involving phosphors, see
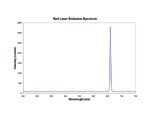
Below are images of a red laser pointer. The peak is at 660 nm, and it has a width at half-height of 4 nm.


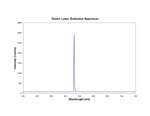
The following images are taken of a green laser pointer for comparison. The peak is at 531 nm, and it has a width of 2 nm.


For background information on how lasers work, see the following references:
For several classroom and laboratory activities involving lasers to use with your students, see
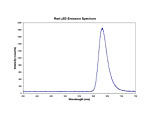
The following images are of a red LED. Note that the bandwidth is substantially larger than that of the red laser. The peak is at 631 nm, and it has a width of 35 nm.


Below are images of a green LED for comparison. The peak is located at 559 nm, and its width is 24 nm.


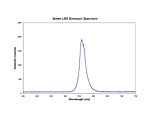
This width of these peaks is evidence for the wider range of energy states available in the band model of solid-state bonding for semiconductors such as those used in a diode. The band gap of the device can be calculated from the wavelength of maximum emission and compared with other colors of LED to investigate the effect of band gap on color. Students may be surprised to see that emission from a green LED is so wide that a bit of red is visible at one end of the spectrum.
The following references contain background information about how LEDs work.
The following reference describes a classroom activity in which students investigate the properties of LEDs.
For a very interesting article about the increasing prevalence of LEDs for common lighting applications see:
| Contents |
These Supplemental Materials accompany the article "Simultaneous Display of Spectral Images and Graphs Using a Web Camera and Fiber-Optic Spectrophotometer" Niece, Brian K. J. Chem. Educ., 2006, 83, 761-764 and are provided with the permission of the Journal.