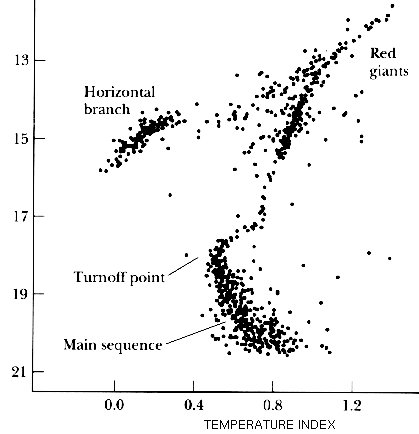
Stellar Evolution as seen on the HR Diagram
|
We can plot the location of a single stars motions with time as its luminosity and temperature changes during its life. This is called an evolutionary track. Six different tracks are shown for 6 different initial masses. Also marked is the time it takes for each star to reach each point on its track since starting at the zero-age main sequence where Hydrogen fusion into Helium first occurs.
The time it takes for a star to evolve is directly related to their mass. High mass stars evolve very quickly (millions or tens of millions of years) while low mass stars evolved (and thus live) a very long time (billions to tens of billions of years). A higher mass means the core is compressed to higher temperatures and densities. The fusion reactions occur much faster, leading to a high luminosity (this is seen) but also a much faster rate of fuel consumption (shorter lifetime). |

|
