Functions and structures of genes, proteins and other biological molecules are usually determined by comparison to other molecules in databases.
Public access and proprietary databases are available for this purpose.
Comparison may be carried out on the basis of several kinds of element, including:
Sequence - nucleotide or aminoacid sequence, domains
SEQ1: MRRVFLSHEPYVIEYHEDWENIITRLVDMYNEVAEWILKDDTSPTPDKFFKQLSVSLKDK
M+ + PY IEYH+DWE +I +LVD+Y+E+AEWILKD+TSP P+ FFKQL
L DK
SEQ2: MKTIKTKSFPYCIEYHDDWEAVINQLVDLYDEIAEWILKDETSPIPENFFKQLQNPLNDK
Secondary structure
- alpha - helical, beta - sheet or coil regions in proteins
loops in nucleic acids
..LLLLL...H..HH.LLLLL.EE...HHHHHHHHH.....HHHH....HHHH......L
...LLLL...HHHHH.LLLLLEEE......HHHHHHHHH...HHEE....HHH....LLL
Tertiary structure - protein folds
Development of methods for rapid identification of biomolecules has therefore advanced in parallel with fast computational programs to compare the sequence of a new sequence or structure with those deposited in a database.
Principles of sequence comparison
Sequences are compared on the basis of distance or similarity, which are directly interrelated.
Higher distance ~ lower similarity and vice versa
e.g. sequences above are qualitatively quite similar, not very distant. How to quantitate?
Distance between sequences is analogous to geometric distance, and obeys the same rules.
Therefore more analyzable mathematically than similarity.
Alignment (a qualitative description) and distance/similarity (a number) are clearly connected, since different alignments will generate different distances/similarities.
The final objective is also to find the alignment where the intersequence distance is minimum or similarity maximum .
This is the optimal alignment. There may be more than one. Why?
Distance Measures
1. Hamming distance
number of positions where sequences differ
what is it for the following alignment:
AGCACACA
ACACACTA ?
2. Hamming + Gap
allows the creation of gaps, but imposes a penalty for them.
3. Levenstein distance.
ascribes numbers to matches & mismatches
4. Scoring Matrices
ascribes different scores to alignments between different
combinations of characters
QUANTITATION OF ALIGNMENTS
Quantitation
of distances
Above methods for calculating costs are called Cost Functions
To get a quantitative measure of distance:
1. Align the sequences
2. Calculate the quantitative cost
of converting one sequence element in the first sequence into the
element
in the same column in the second
3. Calculate the cost for every column of the alignment
4. Sum the total cost for all the individual columns.
5. Determine the alignment which gives a minimum total cost for all the columns; this reflects minimum distance.
Distance can be converted directly to similarity, e.g. by subtracting from the largest distance value
Example: for the two sequences
AGCACACA
ACACACT
Using Levenshtein 1 cost function:
0 for matches,
1 for mismatches to other characters or spaces:
what is the distance between the sequences in the above (ungapped) alignment?
what is it for this alignment:
AGCACACA
ACACACT
is the above the optimal alignment?
Quantitation of similarity:
1. Align the sequences.
2. Assign a number for the relative similarity of
each sequence element to any other.
3. Calculate the similarity for each column in the alignment.
4. Find the alignment with the maximum value for the sum of the similarities
of all the columns.
Using similarity scores of
3 for matches
1 for mismatches
0 for alignment to gaps
what are the similarities of the above 2 sequences in the
two alignments?
DEFINITION: edit distance is the cost of an optimal alignment under a specified cost function, e.g. Levenstein 1.
Insertion of Gaps
Sequences may be revealed to be more similar than initially suspected by inserting gaps into either or both
e.g. the 2 seqs:
AGCACACA don't appear very similar
ACACACT
insertion of a gap reveals them to be quite similar:
AGCACACA
A - CACACT
Pairwise Alignment via Dynamic Programming
Calculating Edit Distances and Optimal Alignments
The number of possible alignments between two sequences is gigantic, and unless the weight function is very simple, it may seem difficult to pick out an optimal alignment. But fortunately, there is an easy and systematic way to find it using an algorithm. The algorithm used most commonly is very famous in biocomputing, and usually called ``the dynamic programming algorithm''. This algorithm is used widely, such as in sequence comparison, analysis of gene expression data from microarrays, and 3D protein structure prediction. It can be described as a "divide and conquer" algorithm, because it starts at a defined place and proceeds in simple steps iteratively. A version commonly used was derived by Needleman & Wunsch.
The four steps in dynamic programming are:
1.Initialization
2. Scoring
3. Matrix filling
4.Traceback
5. Deduction of alignment
1. Initialization
All alignments of characters to (no character) are assigned a distance = 1
2. Scoring
Example: for the two sequences
AGCACACA
ACACACTA
Using Levenshtein 1 cost function:
0 for matches,
1 for mismatches:
Starting at the beginning of the alignment, the distances
for the alignments of the first possible three subsequences
(fragments of the sequences starting at the first character)
are known:
A = 0
AG = 1
A = 1
A
A
AC
The dynamic programming algorithmn progressively calculates the edit distances between all the other subsequences, and finally the complete sequences.
EXAMPLE: calculate the edit distance (minimum cost) of the alignment:
AG
AC
the computer is instructed to start with the alignments of the first subsequences, convert them to the above and save the minimum cost of the three possible conversions.
DEFINITION: The cost of any operation is designated w.
e.g. the cost of replacing A with G is designated w(A,G)
the cost of replacing G with a gap (inserting a gap in the upper sequence) is w(G,-)
the cost of replacing a gap with G (inserting a gap in the lower sequence)
is w(-,G)
The distance between 2 sequences is the sum of the costs of converting the letters of one sequence to those in the other.
The distance between sequences
in the alignment AG is therefore
the minimum of the costs:
AC
(a) of A plus wG ---> (AG)
distance = total cost =
0 + 1 = 1
A
C (AC)
i.e. adding one more residue to each sequence;
(b) A plus w(G,
-), ---> A - G
1 + 1 = 2
AC
A C
i.e. putting a gap in the first sequence;
and (c) AG plus w(-,
C), ---> AG
1 + 1 = 2
A
A - C
i.e. puting a gap in the second sequence.
The least costly way to get to this sequence is therefore by operation (a), where the distance = 1
The optimal alignment therefore has a(n edit) distance = 1
Note: the algorithmn does not indicate the actual alignment at this point, only the distance associated with it.
For the final steps leading to the complete sequences, the edit distance is the minimum of the values for the operations:
AGCACAC AGCACAC
AGCACACA
ACACACT
ACACACTA
ACACACT
edit distance: 2 3 2
+w(A,A) +w(-,A) +w(-,A)
total: 2 4 3
The optimal alignment has an edit distance with the minimum value above (i.e. 2).
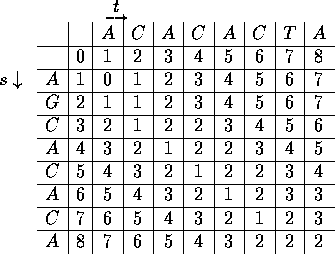
3. Matrix filling
The edit values of the partial alignments are put in a
matrix, the value for the alignment of the complete sequences appearing in
the lower right-hand corner.

Note: diagonal moves between cells involve matches or mismatches
- no change in value signifies a match
horizontal
or vertical moves involve gaps
- these moves cause a change in value
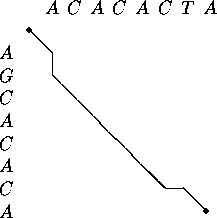
4. Traceback
The optimal alignment(s) is represented by a path through
the matrix depicted using a second algorithm, the traceback algorithm.
This looks for the predecessor of each cell on the optimal alignment path,
starting at the bottom right-hand corner.

Determination of the optimal alignment trace:
Starting at the bottom right-hand corner:
the predecessor to any cell on the trace representing the optimal alignment is identified as that with:
a) a lesser value
if not:
b) an equal value and on a diagonal - a move from a cell with an equal value not on a diagonal involves a gap and a cost = 1
Note: a vertical shift followed by a horizontal one and vice versa adds a gap to both sequences, and is disallowed .
5. Alignment
Derivation of the optimal alignment
In the trace through the matrix, note:
Diagonal lines indicate a match or mismatch in the alignment
Vertical lines indicate deletion of a character from the first sequence, i.e. a gap in the second
(a character must be deleted from the first sequence to make it the same as the second)
Horizontal lines indicate insertion of a character into the first sequence, i.e. a gap in the first
The optimal alignment derived from the matrix (and the only one in this case) is therefore:
AGCACAC -
A
A - CACACTA
with the correct predicted edit distance = 2.
In other cases there may be more than one optimal alignment, because they may have the same edit distance.
Exercise
1. Calculate a dynamic programming matrix and alignment
for the sequences ATT and TTC. How many optimal alignments are there?
How many alignments?
Length Factor in Cost Calculation and Sequence Similarity
Two alignments may have the same cost, even though one involves much longer sequences than the other, and therefore contains sequences which are much less similar, e.g.
AGGA
ATGCAGTAATGACGTA
CGGT
CGCAGGTCCATTGAAG
costs should therefore be divided by the length of the sequence or the sum of the lengths of the two sequences
Gap Models
In the above analyses, gaps were considered as just another character. However there are several ways in which gaps can be manipulated in sequence comparison.
1. No gap alignments
To preserve highly-conserved sequences and structures in genes and proteins, alignments containing gaps may not make sense biologically and be undesirable. In order to obtain no-gap alignments the cost of insertions and deletions can be set to infinity or a large number.
2. Block-indel models
Large deletions are commonly observed in biological sequences,
and these have occurred in one event rather than sequentially.
To reflect this possibility, an initial cost is applied for
the first gap, and then less for each consecutive gap.
Also called affine models.
Exercises: see
VSNS course Hypertext Coursebook, Chapter 1, Section 4
Variations of Pairwise Alignment
1. Global Alignment
An attempt to align the entire sequence using as many
residues as possible, up to both ends of each sequence
ASETTGKSACAF-FWLQKH
|
| | |
| |
AQ-LGGKSGYVPISWATKA
2. Local Alignment (Approximate Pattern Matching)
Identifies regions in two sequences which have high similarity. Dynamic Programming using similarity rather than cost used, with program asked to choose maximum values of 0 or higher numbers. Regions of local similarity rise as islands of positive values above a sea of zeros
---------GKS-----------------------
| | |
---------GKS-----------------------
3. Local Similarity
Finds the region in a longer sequence that has the greatest similarity to a relatively shorter sequence.
Exercises: see
VSNS course Hypertext Coursebook, Chapter 1, Section 4
Web resources:
Chapter 1, Hypertext Coursebook, and Structure Analysis Course at VSNS, University of Bielefeld
Sequence Alignment examples using similarity in Per Kraulis's course at University of Uppsala
Sequence Alignment lecture in the Stanford Computational Biology Course
Book resources:
Bruce S. Weir. Genetic Data Analysis II. Chapter
9 pp 310 - 340
Web - based Pairwise Alignment Methods
using Dynamic Programming
ALION at Stanford - Needleman-Wunsch (global) and Smith-Waterman (local) alignment methods.
ALIGN, LALIGN and LFASTA at Genestream
BLAST 2 SEQUENCES
at NCBI
BAYESIAN
SEQUENCE ALIGNMENT ALGORITHMS
Slide 2 sequences along each other to find the highest scoring ungapped
regions or blocks. These blocks are then joined to produce alignments.
Gap penalties are not needed. A Bayesian statistical
approach is used instead of weight matrices and gap scoring systems.
BALSA : a available at http://bayesweb.wadsworth.org/balsa/balsa.html
PROBLEM 2: Compare the alignment programs above using the human alpha1
and beta globins:
>gi|4504347|ref|NP_000549.1| alpha 1 globin
[Homo sapiens]
MVLSPADKTNVKAAWGKVGAHAGEYGAEALERMFLSFPTTKTYFPHFDLSHGSAQVKGHGKKVADALTNA
VAHVDDMPNALSALSDLHAHKLRVDPVNFKLLSHCLLVTLAAHLPAEFTPAVHASLDKFLASVSTVLTSK
YR
>gi|4504349|ref|NP_000509.1| beta globin
[Homo sapiens]
MVHLTPEEKSAVTALWGKVNVDEVGGEALGRLLVVYPWTQRFFESFGDLSTPDAVMGNPKVKAHGKKVLG
AFSDGLAHLDNLKGTFATLSELHCDKLHVDPENFRLLGNVLVCVLAHHFGKEFTPPVQAAYQKVVAGVAN
ALAHKYH
Examine the effect of varying
open gap and gap extension penalties where available
PROBLEM 3:
Compare the following 2 sequences
(C-terminal regions of the mouse & Drosophila Ah receptors) using pairwise
alignment programs available,
including global and local alignments:
>Dm
CTHRQLMDEEGHDLLGKRTMDFKVSYLDTGLASTYFSEADQLVVPPSTSPTAHALPPPVTPTRPNRRY
KTQLRDFLSTCRSKRKLQQQNQPQTQQTSPLGGQVGSPAPAVAVEYLPDPAAAVAAAYSNLNPMYT
TSPYASAADNLYMGSSMPANAFYPVSENLFHQYRLQGAVGGYYTDYPHSGAPASAYVANGFLSYDG
YAIASKADEKWQETGKYY