Robust
Hypothesis Testing via Lq-Likelihood
Yichen
Qin and Carey E. Priebe
Abstract:
In this article, we introduce a robust testing procedure --- the Lq-Likelihood Ratio test (LqLR)
--- and show that, for the special case of testing the location parameter of a
symmetric distribution in the presence of gross error contamination, our test
dominates the Wilcoxon-Mann-Whitney test at all levels of contamination.
Keywords: Lq-likelihood, relative efficiency,
robustness, hypothesis testing.
Our Test:
Given a data set ![]() following a distribution
following a distribution ![]() , in order to test the
hypotheses
, in order to test the
hypotheses ![]() , we propose our Lq-likelihood
ratio (LqLR) test statistic to be
, we propose our Lq-likelihood
ratio (LqLR) test statistic to be
 ,
,
where ![]() with
q<1. In the article, we have proved the robustness properties of the
proposed LqLR test statistic via analysis of the
asymptotic distribution. By adaptively selecting q via the methodology
described in the paper, the LqLR test provides
protection of the power and size when gross error contamination is brought into
the data.
with
q<1. In the article, we have proved the robustness properties of the
proposed LqLR test statistic via analysis of the
asymptotic distribution. By adaptively selecting q via the methodology
described in the paper, the LqLR test provides
protection of the power and size when gross error contamination is brought into
the data.
Our Main Results:
Suppose we want to test the hypotheses ![]() . We conduct the
following experiment to show the advantage of the LqLR.
With the sample size of n=50, we simulate data from a gross error model
. We conduct the
following experiment to show the advantage of the LqLR.
With the sample size of n=50, we simulate data from a gross error model ![]() where
where
![]() is a
normal distribution with mean
is a
normal distribution with mean ![]() ,
the first component in h(x) is our "idealized" model, the second
component in h(x) is the comtamination.
,
the first component in h(x) is our "idealized" model, the second
component in h(x) is the comtamination.
At different levels of contamination ![]() , we first set
, we first set ![]() to 0, and then generate data sets 3000 times to calculate
the sizes of the tests for: (1) the Lq-likelihood
ratio test (LqLR), (2) the t test i.e., the
log-likelihood ratio, (3) the Wilcoxon test, and (4) the sign test. We
further change
to 0, and then generate data sets 3000 times to calculate
the sizes of the tests for: (1) the Lq-likelihood
ratio test (LqLR), (2) the t test i.e., the
log-likelihood ratio, (3) the Wilcoxon test, and (4) the sign test. We
further change ![]() to
0.34 and repeat the previous procedure to calculate the powers for these
tests. The resutls are displayed in the
following figure.
to
0.34 and repeat the previous procedure to calculate the powers for these
tests. The resutls are displayed in the
following figure.
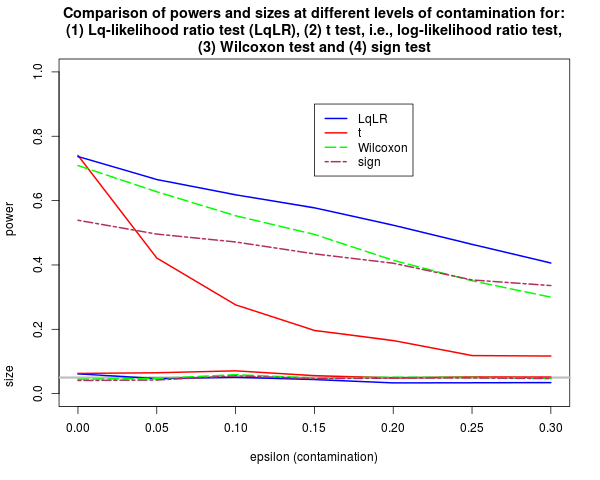
First note that the sizes of all tests are successfully controlled at 0.05.
At zero contamination (i.e., ![]() = 0), the t test (log-likelihood ratio) has the
highest power. The LqLR has almost the same power
(only slightly less than the t test). The Wilcoxon and the sign tests
have the third and the fourth highest powers, but not comparable to the two
likelihood ratio tests. As the contamination becomes more serious (i.e.,
= 0), the t test (log-likelihood ratio) has the
highest power. The LqLR has almost the same power
(only slightly less than the t test). The Wilcoxon and the sign tests
have the third and the fourth highest powers, but not comparable to the two
likelihood ratio tests. As the contamination becomes more serious (i.e., ![]() increases away 0), the t test
degrades the fastest. Its power quickly drops below all other
tests. The Wilcoxon test and the sign test both show good robustness and
their powers degrade at much slower rates. However, the LqLR shows a remarkable robustness. It degrades
slower than the Wilcoxon test (i.e., the blue curve is flatter than the green
curve), and only slightly faster than the sign test (i.e., the blue curve is
steeper than the maroon curve). Since the power of the LqLR at
increases away 0), the t test
degrades the fastest. Its power quickly drops below all other
tests. The Wilcoxon test and the sign test both show good robustness and
their powers degrade at much slower rates. However, the LqLR shows a remarkable robustness. It degrades
slower than the Wilcoxon test (i.e., the blue curve is flatter than the green
curve), and only slightly faster than the sign test (i.e., the blue curve is
steeper than the maroon curve). Since the power of the LqLR at ![]() =
0 is above that of the Wilcoxon test and the sign test, the power of the LqLR dominates both the Wilcoxon test and the sign test at
all levels of contamination! This implies that, not only can the LqLR preserve efficiency almost perfectly at
=
0 is above that of the Wilcoxon test and the sign test, the power of the LqLR dominates both the Wilcoxon test and the sign test at
all levels of contamination! This implies that, not only can the LqLR preserve efficiency almost perfectly at ![]() = 0, but it also obtains
robustness comparable to these nonparametric tests which are known to be very
robust. We conclude that, by losing a little bit efficiency at
= 0, but it also obtains
robustness comparable to these nonparametric tests which are known to be very
robust. We conclude that, by losing a little bit efficiency at ![]() = 0, we have traded for great
robustness at
= 0, we have traded for great
robustness at ![]() >
0. Our LqLR can be considered as a combination
of the log-likelihood ratio test (at
>
0. Our LqLR can be considered as a combination
of the log-likelihood ratio test (at ![]() = 0) and the nonparametric tests (at
= 0) and the nonparametric tests (at ![]() > 0). The reason our
test beats nonparametric tests uniformly is that we can control the amount of
information to use by selecting q, whereas the Wilcoxon test always uses the
rank information, and the sign test always uses the information about whether
each data point is below or above the hypothesized mean.
> 0). The reason our
test beats nonparametric tests uniformly is that we can control the amount of
information to use by selecting q, whereas the Wilcoxon test always uses the
rank information, and the sign test always uses the information about whether
each data point is below or above the hypothesized mean.
Conclusions:
We have introduced a robust testing procedure --- the Lq-likelihood
ratio test (LqLR) --- and demonstrated its advantage
over the traditional likelihood ratio test (the t test), the Wilcoxon test, and
the sign test in the context of the gross error model.
To the extent that the robustness of the Wilcoxon test (minimum asymptotic
relative efficiency (ARE) of the Wilcoxon test vs the t test is 0.864) suggests
that the Wilcoxon test should be the default test of choice (rather than “use
Wilcoxon if there is evidence of non-normality,” the default position should be
“use Wilcoxon unless there is good reason to believe the normality
assumption”), these new results suggest that the LqLR
test should become the new default go-to test for practitioners everywhere!
Miscellaneous:
The website is created with the help of CODECOGS.