The construction of phylogenetic trees depends on the analogy
between distance between sequences and geometric distance. The tree
then represents a map on which sequences lie as objects.
Linkage Algorithms
A family tree is constructed using distances between pairs of sequences in the set. It is assumed that:
1. There exists a common ancestral sequence from which all sequences have evolved
2. Distances between sequence pairs are directly proportional to the time elapsed since the last common ancestor of the sequences;
(not actually true in many cases)
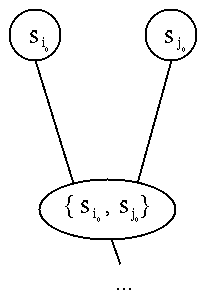
The tree is constructed by taking the two sequences i and j whose distance is minimal, and forming a cluster (i,j) that is treated as a new object, as well as the branching point in the tree at which the two sequences are attached.

The distance d(i,j),k between the cluster and any other sequence k is calculated by one of any alternatives:
d(i,j),k = lower value of d(i,k) and d(j,k) - minimum linkage algorithm
higher value of d(i,k) and d(j,k) - maximum linkage algorithm
mean value of d(i,k) and d(j,k) - average linkage algorithm

The two sequences (objects) can then be replaced by the one object (i,j) with distances to other objects as specified above. Further clusters and distances can then be defined until all sequences are included.
Example at VSNS course
Additive Clustering Procedures
Enable correct tree topologies to be obtained from distances.
Can be used to construct rooted trees as long as simple distances
are first transformed by the Farris Transform, which calculates
the similarity of two sequences, with reference to the common ancestor
of all the sequences.
For a rigorous mathematical treatment see VSNS
Course
Example: If the distance between two sequences is d(i,j), and the ancestral sequence is designated a, the Farris transform S(i,j) of d(i,j) is:
S(i,j) = [d(i,a) + d(j,a)] - d(i,j)
S is a measure of similarity, and can thus be converted into distance by subtraction from a large constant.
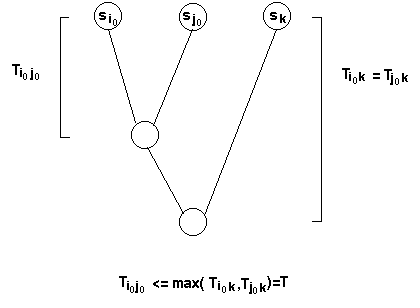
In some sets of sequences, the correct tree is not predicted by initially choosing the sequences with smallest distance. Applying the Farris Transform corrects this deficiency, and enables the correct tree topology to be determined. The sequence distances must obey the Four Point Condition.
di,j + dk,l < max ((di,k + dj,l) or (di,l + dj,k)) for any four sequences i,j,k,l
Example VSNS course Section 4.14
For the seven sequences:

Using a linkage algorithm and the matrix of Hamming distances directly does not yield the correct phylogenetic tree
After transformation and conversion from similarity to distance the correct tree is predicted.
Additive Linkage Algorithm:
If the distances obey the Four Point Condition, the correct unrooted tree topology can be predicted more simply by:
1. Identification of the pair of sequences that form the cluster with greatest distances to all other members of the set,
i.e. for which the quantity
[d(i,k) + d(j,k)] - d(i,j) is maximum, where k is any sequence other than i or j
2. Calculation of the distance from the i,j cluster to the sequence k, given by
1/2([d(i,k) + d(j,k)] - d(i,j))
This process is repeated until just one cluster is left.
Example: VSNS course Chapter 3, section 4.15
The sequences:

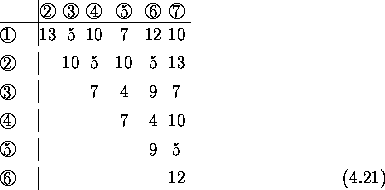
give rise, after alignment to the distance matrix:

Cluster with greatest distance to other sequences is (2,6), e.g. distance to sequence 1 = 1/2([d(2,1) + d(6,1)] - d(2,6)) = 10
from seqs. 3,4,5,7 = 6,2,7,10 resp.
Next most distant cluster is (1,3) with distances to sequences (2,6), 4, 5 and 7 of 6,6, 3 and 6 respectively
then (5,7) with distances to (1,3), (2,6) and 4 of 2,6 and 6 respectively
This process is repeated until just one cluster is left, and generates the same tree as derived from the Farris Transform, but unrooted.
Average Linkage Clustering (UPGMA)
Unweighted Pair-Group Method using an Arithmetic Average (UPGMA) defines intercluster distance as the average of all the pairwise distances for members of two clusters. Distances used are Jukes-Cantor distances (K), which depend on the observed numbers of differences between each pair. If a proportion q of the residues in the two sequences is the same, an estimate of K is:
K = 3 ln
3
4 4q - 1
Example: primate mitochondrial sequences:
Numbers of differences (below diagonal) and Jukes-Cantor
distances (above diagonal) for five mitochondrial sequences.
|
|
|
|
|
|
|
|
|
|
|
|
|
|
|
|
|
|
|
|
|
|
|
|
|
|
|
|
|
|
|
|
|
|
|
|
|
|
|
|
|
|
Pair with least distance (human, chimp) joined to form a cluster. The distance of each other sequence from this cluster is found as the average distance from the sequence to members of the cluster:
d(hu-ch),go = 1/2(dhu,go + dch,go) = 0.037
d(hu-ch),or = 1/2(dhu,or + dch,or) = 0.135
d(hu-ch),gi = 1/2(dhu,gi + dch,gi) = 0.189
The smallest distance is now between the human/chimp cluster and gorilla, and so a new cluster is assembled. New distances are now:
d(hu-ch-go),or = 1/3(dhu,or + dch,or + dgo,or) = 0.121
d(hu-ch-go),gi = 1/3(dhu,gi + dch,gi + dgo,gi) = 0.185
A new cluster is now assembled including orang, and the new distance to gibbon calculated:
d(hu-ch-go-or),gi = 1/4(dhu,gi + dch,gi + dgo,gi + dor,gi) = 0.183
A dendrogram is then constructed with branchpoints midway
between between sequences or clusters.
The distance between a pair of sequences is the sum of
the branch lengths.
Human
|
| |
Chimp
|
|
|
|
| Gorilla
|
|
|
|
Orangutan
|
|
Gibbon
|
|
| |
0.092
0.060
0.019 0.007
Cluster systems
Alternatively to Tree systems, sequences can be separated into clusters whose members are more similar to each other than to members of other clusters. The clusters should therefore represent sequences from monophyletic groups. Split Decomposition is one Cluster System.
Split Decomposition
Facilitates phylogenetic analysis considerably due to :
unprejudiced approach
computer graphics support
Collection of sequences is split such that at (at least ) one of the two subcollections is a monophyletic group
Split is valid (a d-split) if the four-point condition is obeyed :
di,j + dk,l < max ((di,k + dj,l) or (di,l + dj,k)) for any four sequences i,j,k,l
or in the case of all pairs of sequences, (s
and s') in one block and (t and t') in the other:
d(s,s') + d(t,t') < max [(d(s,t) + d(s',t')]
or [(d(s,t') + d(s',t)]
In addition every d-split is associated with an isolation index :
½ min (max(d(s,t) + d(s',t') or d(s,t') + d(s',t)) - d(s,s' - t,t')
which measures the degree to which the split is supported by the data
If d satisfies the four-point condition, the isolation index coincides exactly with the length of the unique branch of the tree associated with d which separates the (smallest ) subtree connecting all the A labelled nodes from the (smallest ) subtree containing all the B - labelled nodes.
Maximum Likelihood Methods
Instead of using distances, these methods attempt to make explicit and efficient use of all the available information. Include estimation of branch lengths, employing standard statistical methods. Assume a tree which represents the phylogeny of the sequences, then choose branch lengths to maximize the probability of the data given that tree. The probability of possible trees is then compared, and the tree with greatest probablity chosen. The number of possible trees is usually very large, therefore intensive computational methods are required. The most popular method of this type is the PHYLIP algorithm, which starts with a two-sequence tree and adds more sequences. Local rearrangements are carried out to see if this improves likelihood before the next sequence is added.
Breakpoint Analysis
Based on the concepts of breakpoints in genomes
A breakpoint occurs any time two genes are adjacent in one genome but are not adjacent in a genome to which the first is compared. An internal node's label is derived by finding the gene order that minimizes the number of breakpoints between a node and its three closest neighbors. A label that minimizes the amount of change at this place in the tree is found. A travelling salesperson problem solver—a common, if expensive, mathematical method of solving optimization problems—is used to find the median, calculating the hypothesized gene order data for each node.
Example
- building of phylogenetic tree for Campanula (bluebell) species using
chloroplast genomes.
Other Web-based courses on Phylogenetic Analysis
1.VSNS course - The Mathematical Basis of Phylogenetic Analysis.
2. Stanford course - Distance Based Phylogenies.
3. BCG course at Weizmann Institute - Phylogenetic Analysis
Web Resources for Phylogenetic Analysis
1. Phylogenetic tree generation at EBI ClustalW web window
2. Phylogenetic Trees at the Blocks Multiple Alignment Processor
3. Phylogenetic
Analysis at the All-All server. Accepts sequences or distances as input.
Returns predicted trees by email in postscript text. Needs a postscript
reader such as Ghostscript
to display tree.
http://www.cbrg.ethz.ch/services/PhylogeneticTree/index
4. Phylogenetics Software Resources (University of California)
5. PHYLIP
at the University of Singapore and other places.
6. PhIGs
(Phylogenetically Identified Groups): an attempt to cluster genes
from multiple organisms into groups that are all descended from a single
ancestral gene.
This clustering is accomplished by using the known phylogenetic relationships to guide the creation of the PhIGs.
By studying genes within their evolutionary context we can differentiate between orthology versus paralogy relationships, find lineage specific evolution and facilitate functional, comparative and phylogenomic research.Example 1:
Obtain trees from the servers 1 and 2 above for the human Transforming Growth Factor Beta family proteins and a decapentaplegic, a related
protein from Drosophila Melanogaster:
>humanbeta1
MPPSGLRLLL LLLPLLWLLV LTPGRPAAGL STCKTIDMEL VKRKRIEAIR GQILSKLRLASPPSQGEVPP
GPLPEAVLAL YNSTRDRVAG ESAEPEPEPE ADYYAKEVTR YDKFKQSTHS IYMFFNTSEL REAVPEPVLL
SRAELRLLRL KLKVEQHVEL YQKYSNNSWRYLSNRLLAPS DSPEWLSFDV TGVVRQWLSR GGEIEGFRLS
AHCSCDSRDN TGRRGDLATI HGMNRPFLLL MATPLERAQH LQSSRHRRAL DTNYCFSSTE KNCCVRQLYIDFRKDLGWKW
IHEPKGYHAN FCLGPCPYIW SLDTQYSKVL ALYNQHNPGA LEPLPIVYYV GRKPKVEQLS NMIVRSCKCS
>humanbeta2
MHYCVLSAFL ILHLVTVALS LSTCSTLDMD QFMRKRIEAI RGQILSKLKL TSPPEDYPEPEEVPPEVISI
YNSTRDLLQE KASRRAAACE RERSDEEYYA KEVYKIDMPP FFPSENAIPPTFYRPYFRIV RFDVSAMEKN
ASNLVKAEFR VFRLQNPKAR VPEQRIELYQ TQRYIDSKVV KTRAEGEWLS FDVTDAVHEW LHHKDRNLGF
KISLHCPCCT FVPSNNYIIPNKSEELEARF AGIDGTSTYT SGDQKTIKST RKKNSGKTPH LLLMLLPSYR
LESQQTNRRKKRALDAAYCF RNVQDNCCLR PLYIDFKRDL GWKWIHEPKG YNANFCAGAC PYLWSSDTQHSRVLSLYNTI
NPEASASPCC VSQDLEPLTI LYYIGKTPKI EQLSNMIVKS CKCS
>humanbeta3
MKMHLQRALV VLALLNFATV SLSLSTCTTL DFGHIKKKRV EAIRGQILSK LRLTSPPEPTVMTHVPYQVL
ALYNSTRELL EEMHGEREEG CTQENTESEY YAKEIHKFDM IQGLAEHNELAVCPKGITSK VFRFNVSSVE
KNRTNLFRAE FRVLRVPNPS SKRNEQRIEL FQILRPDEHIAKQRYIGGKN LPTRGTAEWL SFDVTDTVRE
WLLRRESNLG LEISIHCPCH TFQPNGDILENIHEVMEIKF KGVDNEDDHG RGDLGRLKKQ KDHHNPHLIL
MMIPPHRLDN PGQGGQRKKR
ALDTNYCFRN LEENCCVRPL YIDFRQDLGW KWVHEPKGYY ANFCSGPCPY LRSADTTHSTVLGLYNTLNP
EASASPCCVP QDLEPLTILY YVGRTPKVEQ LSNMVVKSCK CS
>decapentaplegic
MRAWLLLLAV LATFQTIVRV ASTEDISQRF IAAIAPVAAH IPLASASGSG SGRSGSRSVGASTSTALAKA
FNPFSEPASF SDSDKSHRSK TNKKPSKSDA NRQFNEVHKP RTDQLENSKNKSKQLVNKPN HNKMAVKEQR
SHHKKSHHHR SHQPKQASAS TESHQSSSIE SIFVEEPTLVLDREVASINV PANAKAIIAE QGPSTYSKEA
LIKDKLKPDP STLVEIEKSL LSLFNMKRPPKIDRSKIIIP EPMKKLYAEI MGHELDSVNI PKPGLLTKSA
NTVRSFTHKD SKIDDRFPHH
HRFRLHFDVK SIPADEKLKA AELQLTRDAL SQQVVASRSS ANRTRYQVLV YDITRVGVRGQREPSYLLLD
TKTVRLNSTD TVSLDVQPAV DRWLASPQRN YGLLVEVRTV RSLKPAPHHHVRLRRSADEA HERWQHKQPL
LFTYTDDGRH KARSIRDVSG GEGGGKGGRN KNHDDTCRRH SLYVDFSDVG WDDWIVAPLG YDAYYCHGKC
PFPLADHFNS TNHAVVQTLVNNMNPGKVPK ACCVPTQLDS VAMLYLNDQS TVVLKNYQEM TVVGCGCR
Example 2: Generate trees for the human paralogs
of the human Map3k paralogs 1-4 and the ortholog from Ciona Intestinalis:
>Hs1
MGSQALQEWGQREPGRWPDPAGKKDVRREASDSGRAGTWPRGPSECSPREKMAAAAGNRASSSGFPGARA
TSPEAGGGGGALKASSAPAAAAGLLREAGSGGRERADWRRRQLRKVRSVELDQLPEQPLFLAASPPASST
SPSPEPADAAGSGTGFQPVAVPPPHGAASRGGAHLTESVAAPDSGASSPAAAEPGEKRAPAAEPSPAAAP
AGREMENKETLKGLHKMDDRPEERMIREKLKATCMPAWKHEWLERRNRRGPVVVKPIPVKGDGSEMNHLA
AESPGEVQASAASPASKGRRSPSPGNSPSGRTVKSESPGVRRKRVSPVPFQSGRITPPRRAPSPDGFSPY
SPEETNRRVNKVMRARLYLLQQIGPNSFLIGGDSPDNKYRVFIGPQNCSCARGTFCIHLLFVMLRVFQLE
PSDPMLWRKTLKNFEVESLFQKYHSRRSSRIKAPSRNTIQKFVSRMSNSHTLSSSSTSTSSSENSIKDEE
EQMCPICLLGMLDEESLTVCEDGCRNKLHHHCMSIWAEECRRNREPLICPLCRSKWRSHDFYSHELSSPV
DSPSSLRAAQQQTVQQQPLAGSRRNQESNFNLTHYGTQQIPPAYKDLAEPWIQVFGMELVGCLFSRNWNV
REMALRRLSHDVSGALLLANGESTGNSGGSSGSSPSGGATSGSSQTSISGDVVEACCSVLSMVCADPVYK
VYVAALKTLRAMLVYTPCHSLAERIKLQRLLQPVVDTILVKCADANSRTSQLSISTLLELCKGQAGELAV
GREILKAGSIGIGGVDYVLNCILGNQTESNNWQELLGRLCLIDRLLLEFPAEFYPHIVSTDVSQAEPVEI
RYKKLLSLLTFALQSIDNSHSMVGKLSRRIYLSSARMVTTVPHVFSKLLEMLSVSSSTHFTRMRRRLMAI
ADEVEIAEAIQLGVEDTLDGQQDSFLQASVPNNYLETTENSSPECTVHLEKTGKGLCATKLSASSEDISE
RLASISVGPSSSTTTTTTTTEQPKPMVQTKGRPHSQCLNSSPLSHHSQLMFPALSTPSSSTPSVPAGTAT
DVSKHRLQGFIPCRIPSASPQTQRKFSLQFHRNCPENKDSDKLSPVFTQSRPLPSSNIHRPKPSRPTPGN
TSKQGDPSKNSMTLDLNSSSKCDDSFGCSSNSSNAVIPSDETVFTPVEEKCRLDVNTELNSSIEDLLEAS
MPSSDTTVTFKSEVAVLSPEKAENDDTYKDDVNHNQKCKEKMEAEEEEALAIAMAMSASQDALPIVPQLQ
VENGEDIIIIQQDTPETLPGHTKAKQPYREDTEWLKGQQIGLGAFSSCYQAQDVGTGTLMAVKQVTYVRN
TSSEQEEVVEALREEIRMMSHLNHPNIIRMLGATCEKSNYNLFIEWMAGGSVAHLLSKYGAFKESVVINY
TEQLLRGLSYLHENQIIHRDVKGANLLIDSTGQRLRIADFGAAARLASKGTGAGEFQGQLLGTIAFMAPE
VLRGQQYGRSCDVWSVGCAIIEMACAKPPWNAEKHSNHLALIFKIASATTAPSIPSHLSPGLRDVALRCL
ELQPQDRPPSRELLKHPVFRTTW
>Hs2a
MDDQQALNSIMQDLAVLHKASRPALSLQETRKAKSSSPKKQNDVRVKFEHRGEKRILQFPRPVKLEDLRS
KAKIAFGQSMDLHYTNNELVIPLTTQDDLDKALELLDRSIHMKSLKILLVINGSTQATNLEPLPSLEDLD
NTVFGAERKKRLSIIGPTSRDRSSPPPGYIPDELHQVARNGSFTSINSEGEFIPESMEQMLDPLSLSSPE
NSGSGSCPSLDSPLDGESYPKSRMPRAQSYPDNHQEFSDYDNPIFEKFGKGGTYPRRYHVSYHHQEVIMM
VVKLFQELEGPRGTSLRSPVSFSPTDHSLSTSSGSSIFTPEYDDSRIRRRGSDIDNPTLTVMDISPPSRS
PRAPTNWRLGKLLGQGAFGRVYLCYDVDTGRELAVKQVQFDPDSPETSKEVNALECEIQLLKNLLHERIV
QYYGCLRDPQEKTLSIFMEYMPGGSIKDQLKAYGALTENVTRKYTRQILEGVHYLHSNMIVLRDIKGANI
LRDSTGNVKLGDFGASKRLQTICLSGTGMKSVTGTPYWMSPEVISGEGYGRKADIWSVACTVVEMLTEKP
PWAEFEAMAAIFKIATQPTNPKLPPHVSDYTRDFLKRIFVEAKLRPSADELLRHMFVHYH
>Hs3a
MDEQEALNSIMNDLVALQMNRRHRMPGYETMKNKDTGHSNRQKKHNSSSSALLNSPTVTTSSCAGASEKK
KFLSDVRIKFEHNGERRIIAFSRPVKYEDVEHKVTTVFGQPLDLHYMNNELSILLKNQDDLDKAIDILDR
SSSMKSLRILLLSQDRNHNSSSPHSGVSRQVRIKASQSAGDINTIYQPPEPRSRHLSVSSQNPGRSSPPP
GYVPERQQHIARQGSYTSINSEGEFIPETSEQCMLDPLSSAENSLSGSCQSLDRSADSPSFRKSRMSRAQ
SFPDNRQEYSDRETQLYDKGVKGGTYPRRYHVSVHHKDYSDGRRTFPRIRRHQGNLFTLVPSSRSLSTNG
ENMGLAVQYLDPRGRLRSADSENALSVQERNVPTKSPSAPINWRRGKLLGQGAFGRVYLCYDVDTGRELA
SKQVQFDPDSPETSKEVSALECEIQLLKNLQHERIVQYYGCLRDRAEKTLTIFMEYMPGGSVKDQLKAYG
ALTESVTRKYTRQILEGMSYLHSNMIVHRDIKGANILRDSAGNVKLGDFGASKRLQTICMSGTGMRSVTG
TPYWMSPEVISGEGYGRKADVWSLGCTVVEMLTEKPPWAEYEAMAAIFKIATQPTNPQLPSHISEHGRDF
LRRIFVEARQRPSAEELLTHHFAQLMY
>Hs4
MREAAAALVPPPAFAVTPAAAMEEPPPPPPPPPPPPEPETESEPECCLAARQEGTLGDSACKSPESDLED
FSDETNTENLYGTSPPSTPRQMKRMSTKHQRNNVGRPASRSNLKEKMNAPNQPPHKDTGKTVENVEEYSY
KQEKKIRAALRTTERDHKKNVQCSFMLDSVGGSLPKKSIPDVDLNKPYLSLGCSNAKLPVSVPMPIARPA
RQTSRTDCPADRLKFFETLRLLLKLTSVSKKKDREQRGQENTSGFWLNRSNELIWLELQAWHAGRTINDQ
DFFLYTARQAIPDIINEILTFKVDYGSFAFVRDRAGFNGTSVEGQCKATPGTKIVGYSTHHEHLQRQRVS
FEQVKRIMELLEYIEALYPSLQALQKDYEKYAAKDFQDRVQALCLWLNITKDLNQKLRIMGTVLGIKNLS
DIGWPVFEIPSPRPSKGNEPEYEGDDTEGELKELESSTDESEEEQISDPRVPEIRQPIDNSFDIQSRDCI
SKKLERLESEDDSLGWGAPDWSTEAGFSRHCLTSIYRPFVDKALKQMGLRKLILRLHKLMDGSLQRARIA
LVKNDRPVEFSEFPDPMWGSDYVQLSRTPPSSEEKCSAVSWEELKAMDLPSFEPAFLVLCRVLLNVIHEC
LKLRLEQRPAGEPSLLSIKQLVRECKEVLKGGLLMKQYYQFMLQEVLEDLEKPDCNIDAFEEDLHKMLMV
YFDYMRSWIQMLQQLPQASHSLKNLLEEEWNFTKEITHYIRGGEAQAGKLFCDIAGMLLKSTGSFLEFGL
QESCAEFWTSADDSSASDEIIRSVIEISRALKELFHEARERASKALGFAKMLRKDLEIAAEFRLSAPVRD
LLDVLKSKQYVKVQIPGLENLQMFVPDTLAEEKSIILQLLNAAAGKDCSKDSDDVLIDAYLLLTKHGDRA
RDSEDSWGTWEAQPVKVVPQVETVDTLRSMQVDNLLLVVMQSAHLTIQRKAFQQSIEGLMTLCQEQTSSQ
PVIAKALQQLKNDALELCNRISNAIDRVDHMFTSEFDAEVDESESVTLQQYYREAMIQGYNFGFEYHKEV
VRLMSGEFRQKIGDKYISFARKWMNYVLTKCESGRGTRPRWATQGFDFLQAIEPAFISALPEDDFLSLQA
LMNECIGHVIGKPHSPVTGLYLAIHRNSPRPMKVPRCHSDPPNPHLIIPTPEGFSTRSMPSDARSHGSPA
AAAAAAAAVAASRPSPSGGDSVLPKSISSAHDTRGSSVPENDRLASIAAELQFRSLSRHSSPTEERDEPA
YPRGDSSGSTRRSWELRTLISQSKDTASKLGPIEAIQKSVRLFEEKRYREMRRKNIIGQVCDTPKSYDNV
MHVGLRKVTFKWQRGNKIGEGQYGKVYTCISVDTGELMAMKEIRFQPNDHKTIKETADELKIFEGIKHPN
LVRYFGVELHREEMYIFMEYCDEGTLEEVSRLGLQEHVIRLYSKQITIAINVLHEHGIVHRDIKGANIFL
TSSGLIKLGDFGCSVKLKNNAQTMPGEVNSTLGTAAYMAPEVITRAKGEGHGRAADIWSLGCVVIEMVTG
KRPWHEYEHNFQIMYKVGMGHKPPIPERLSPEGKDFLSHCLESDPKMRWTASQLLDHSFVKVCTDEE
>Ci
IQVGRTSPFSKRVPSPTSRGLIKGRNPSPKGRNPSPKGRNPSPNRRPPSPNTDGVSPYSPEATAKKVNRV
LKARLYLLQQNGPNSFRIGGDSPEHKYLVIIGPQSCNCGRGLFCIHVLFVMLRVFQLEPTSTLLWRKTLK
NYEVVETLFKSYHERCNSRISPKKKSRVQRLVSHLASGTDKHADTSSNSDDQCSSKGEEENCPICLLQMV
DGESVTVCEVGCRNKLHTHCVNIWAEECRRNGGSLKCPLCRIVWKPADTPGGTGIRPLMVEIPHEYTDLA
DTWTQVAFGWEMVSCLFSTHPNVRENALRRLSHDITGALLTNSQMSDTNDDRTSDDSDSSMRGAVGGTSS
SLSSNAYLASCCAILAMVCSDPEYRVYITALRTLRAMMAYTQCRTNNDVTAFQRLLAPVIETILFKCADS
NRRNVQLSVSTVMELCRGQSGELAVGKEMVSGESLGVGSVGFLLSFLDFGGSPDTSSWQWMLGRLNALGE
LCREFKSELSIRFVVVGICVEGMDSTEAQALLCVARFAVSCMNNTSQPRVCKMARRVFLQSSTSSTSCCE
DFRRASERRLSVRELADNINRKQNRLAVANRGEKSKKLDSAPIGGFRKYSNDKSPSSAPTDVLKEDSVKP
APKTKQNEEPLAHTFAKKSTLLSKTLDEDVSQSDVAQLSPFLGANQSNSSRIPTRGILKNSSIPLVPTPP
NRMLSASSGVSDGFGATTDSGVGTDSSYKGSIGIMSSKSSNIQHLTSPESETSPEEIYGKNTQRKKDDMA
SGEDSSGPSIKRPVRPKQLRRPTAGSSRKPRALLHYHQQSRRHRTPHPEDSDHYINDPDSPMATRSMEED
IPSTSASLKQKSQLSSSVEDLLAESDHSQAEKTPVTFKSEIGWYIGDALESYEADLAMQCSCQMQIEEEE
DKLFAHTLAVSYIQDALPMVPHLSYTEEEPDIVRVQDEVKCTDIQKEYKENNQWCKGAQIGLGAFSACYQ
ARDMFTGTLMAVKQVNHVRCSAVEERQVLAVITEEISLMRRLSHPNIVRLHGITKEGPLYNIFIEWCAGG
SVSTLLSHYGAFNEAVIMNYTLQLLRGLSYIHEQFLIHRDIKGANLLIDSTGQRXRVSDFGAAARLASKG
TGAGEFQGQLLGTIAFMAPEVLRGEQYGRSCDVWGCGCVITEMASGKPPWEADMHSNHLALIFKIASSPT
What ancestral relationships can you draw between the proteins
in each case?